Ice coverage over the Great Lakes is a huge factor in weather patterns over the region and an indicator of future lake levels. Thumbwind consolidates and summarizes the Great Lakes ice cover from US and Canadian agencies and presents it on this single page.
Table of Contents
Summary of Current Ice Conditions June 24, 2026
As of June 24, 2026, NOAA reports [great_lakes_total_ice_lowercase] across the region. With colder temperatures and more snow coverage, the initial ice coverage season has started in earnest. 1% of ice formation is reported on Saginaw Bay between Sebewaing and Caseville, including Wild Fowl Bay. We are experiencing a normal rate of ice formations at this time.
Graphics for ice conditions on this page depict the latest report offered.
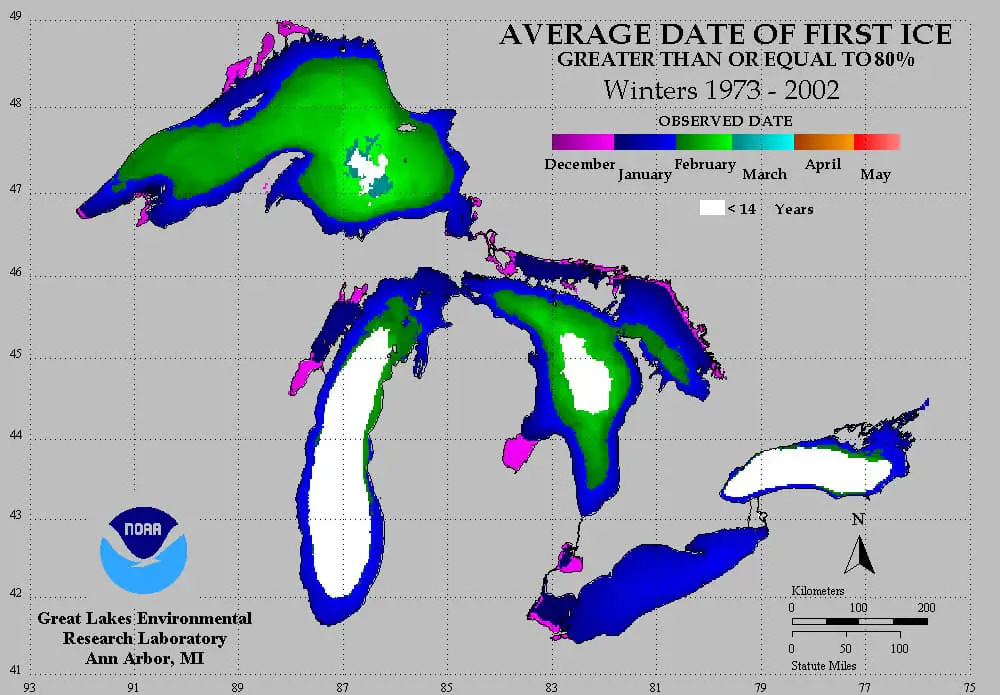
Estimates of First Ice Coverage on the Great Lakes
The Great Lakes Environmental Research Laboratory in Ann Arbor, Michigan, compiled data from 1973 through 2002. Their data gave an excellent estimate of when the first significant ice coverage can be expected by month.
Current Average Comparison of Ice Coverage – Lake Huron
We are starting the winter of 2025-2026, with NOAA reporting a typical average for total ice cover in Lake Huron. [lake_huron_ice_coverage] As you can see from the graph below, ice cover is at a beginning-of-the-season low.
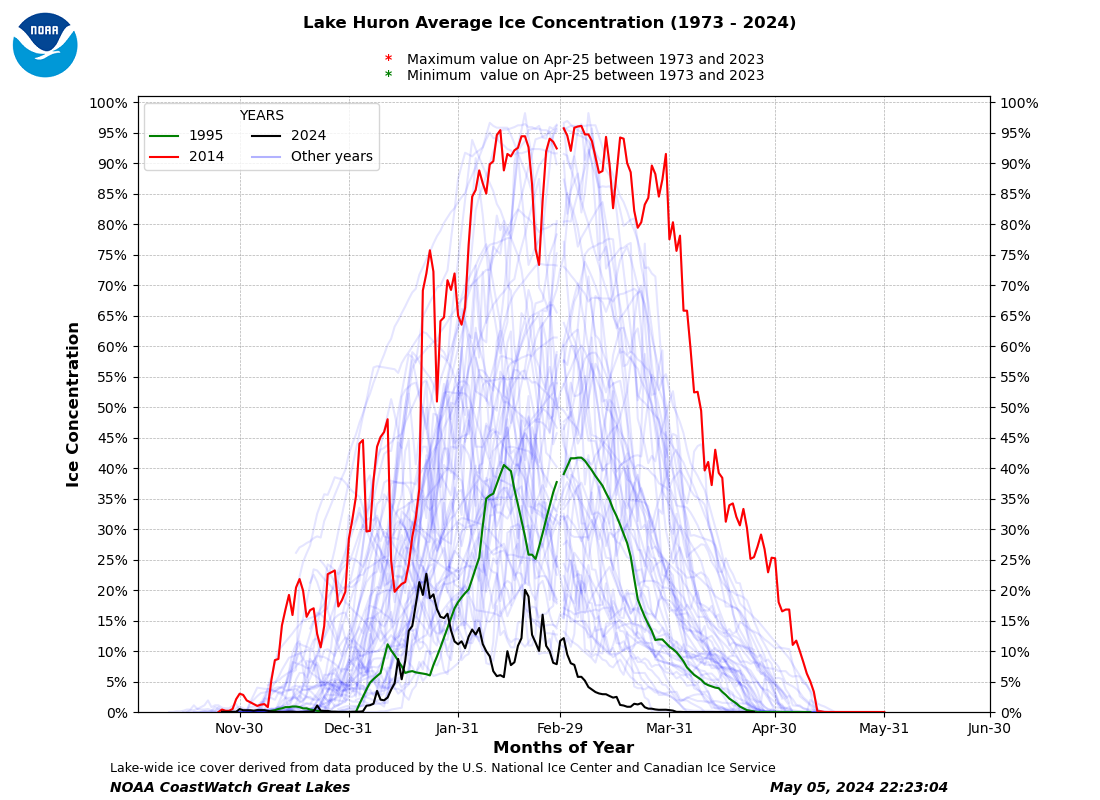
The graph for Lake Huron’s average ice concentration from 1973 to 2025 illustrates the seasonal ice cycle, with ice formation beginning in December, peaking between late February and early March, and melting by April. Highlighted years, such as 1994 (green), 2003 (red), and 2025 (black), reveal variations in maximum ice coverage. For instance, 1994 demonstrates an exceptionally high peak, while 2003 reflects a similar but slightly lower coverage. The data show that Lake Huron consistently reaches higher concentrations than some of the other Great Lakes, likely due to its shallower depth and smaller size. The wide variation in the blue lines representing other years underscores the sensitivity of ice coverage to yearly climatic conditions, including temperature, wind, and precipitation patterns. These trends indicate both seasonal weather dynamics and the potential influence of long-term climate change.
Current Average Comparison of Ice Coverage – Lake Michigan
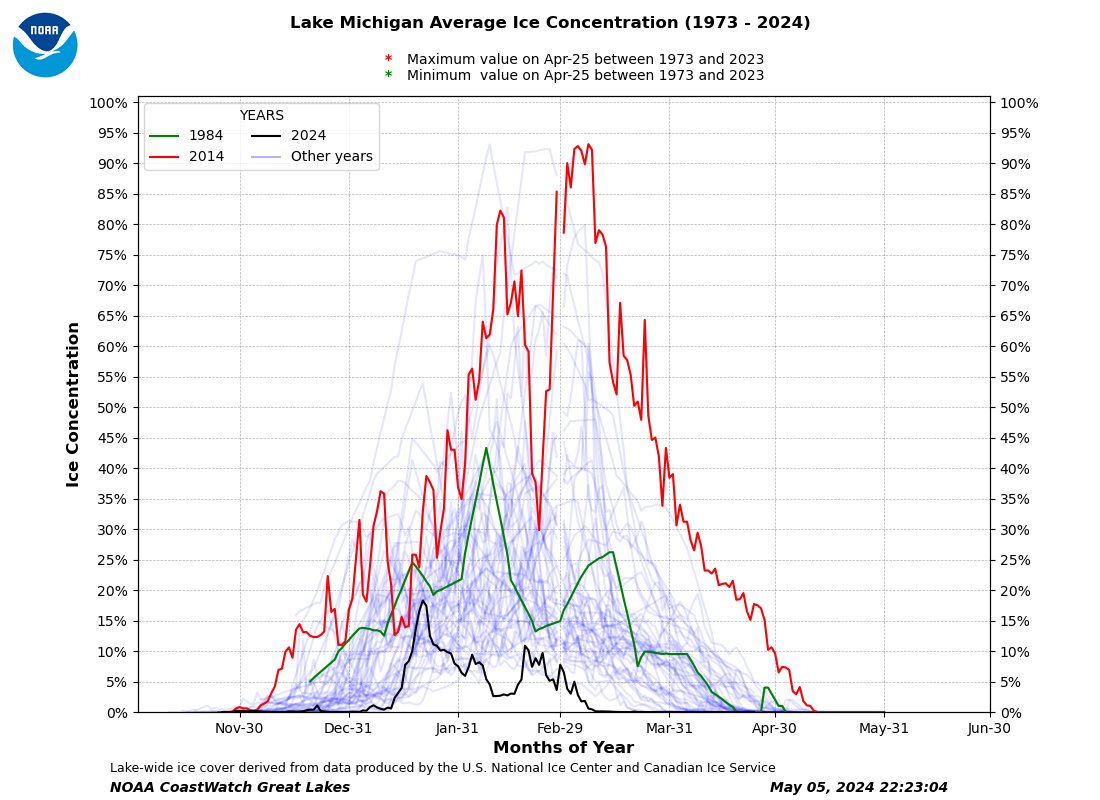
[lake_michigan_ice_coverage] The graph for Lake Michigan’s average ice concentration from 1973 to 2025 displays a seasonal pattern with ice coverage typically increasing from December, peaking around February, and then receding in March and April. Highlighted years, such as 1994 (green), 2015 (red), and 2025 (black), show considerable variability in ice coverage. 1994 shows higher-than-average ice concentration, indicating a colder winter, while 2015 shows lower-than-average ice concentration, indicating a milder winter. The blue lines representing other years indicate significant interannual variability, with some years closely following the highlighted trends and others diverging sharply. Lake Michigan’s ice formation is influenced by its depth and prevailing winter weather conditions, indicating seasonal and long-term climatic changes.
Current Average Comparison of Ice Coverage – Lake Superior
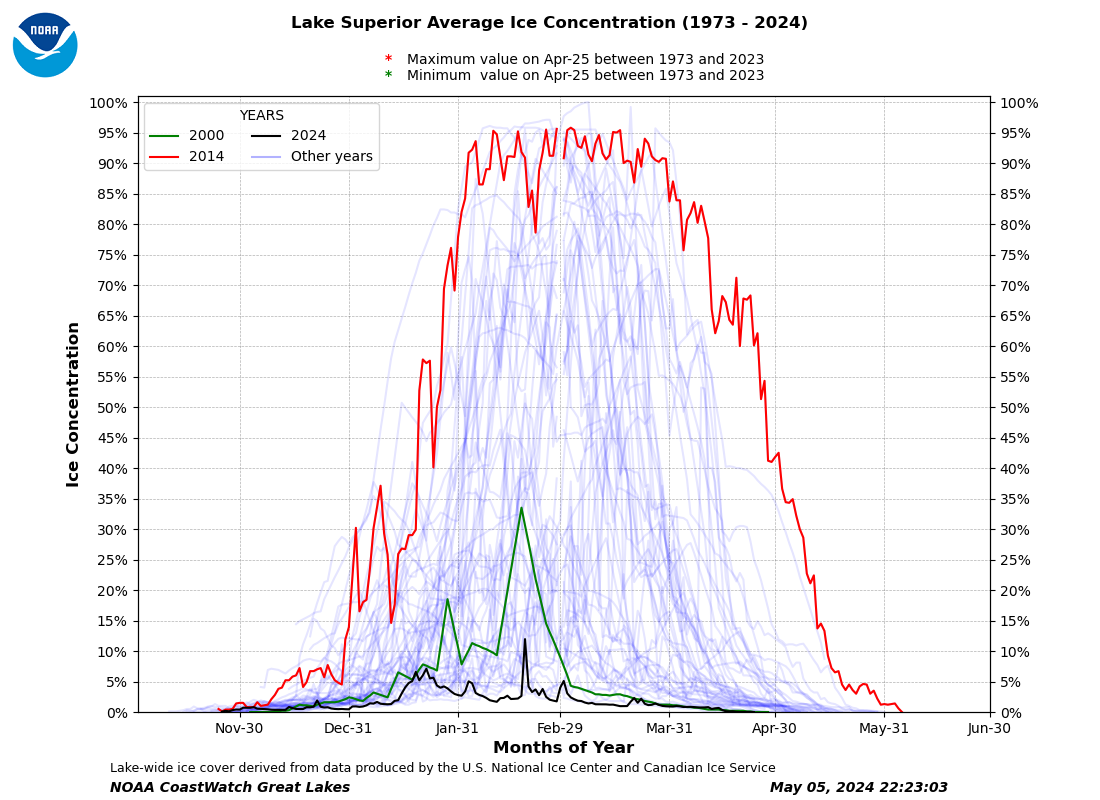
[lake_superior_ice_coverage] The graph for Lake Superior’s average ice concentration from 1973 to 2025 reveals a pattern of seasonal ice development, with ice coverage typically increasing in December, peaking around late February or early March, and then declining into April. The dataset shows substantial year-to-year variability, with highlighted years such as 1992, 1998, and 2025 exhibiting distinct ice patterns. Notably, 1992 exhibits a high ice concentration that peaks sharply in late February, while 1998 and 2025 remain significantly lower, indicating milder winters. The large variability among the blue lines representing other years highlights the influence of changing climatic conditions, regional temperature variations, and wind patterns on ice formation. Lake Superior’s deep waters and vast surface area contribute to its variability, underscoring its sensitivity to seasonal and long-term climate trends.
Current Average Comparison of Ice Coverage – Lake Erie
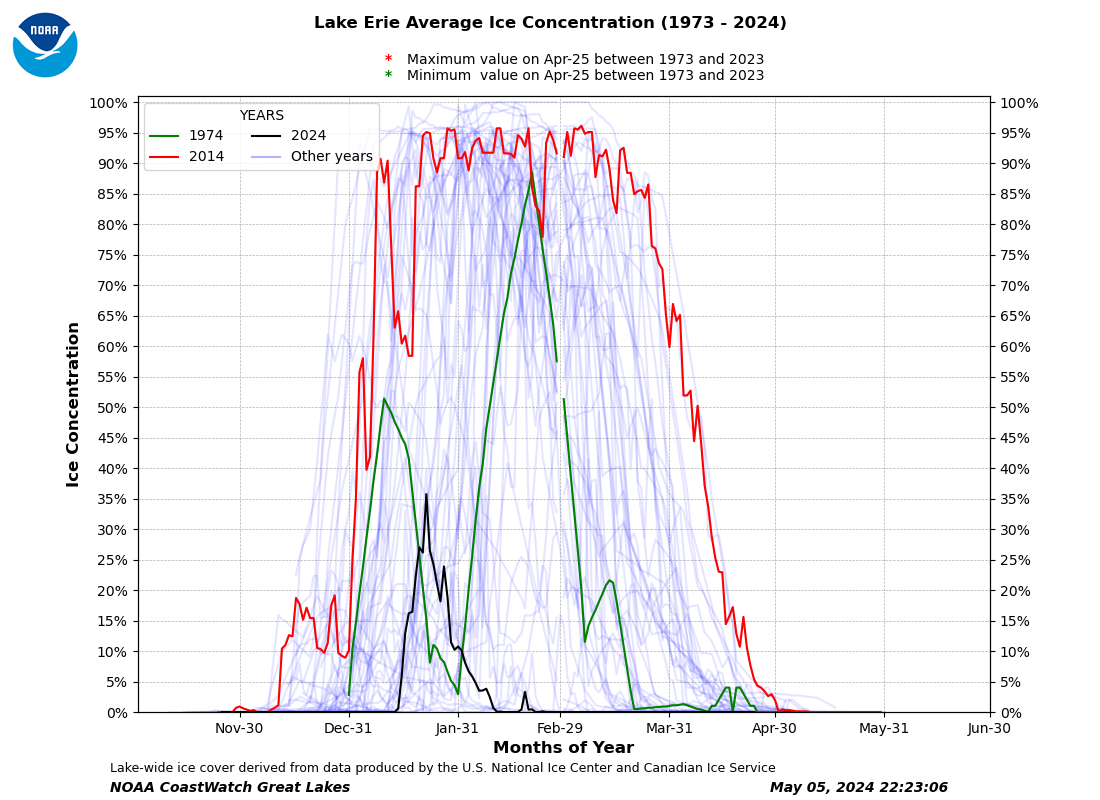
[lake_erie_ice_coverage] The graph for Lake Erie’s average ice concentration from 1973 to 2025 highlights the typical seasonal progression of ice formation. Ice concentration increases sharply in late December, peaks in February, then declines rapidly in March and April. The blue lines represent year-to-year variations, with distinct patterns visible for highlighted years such as 1992, 2006, and 2025. Lake Erie exhibits significantly higher average ice concentrations than other Great Lakes, likely due to its shallow depth, making it more prone to freezing. Specific years, like 1992, reached near-total ice coverage, indicating extreme winter conditions, while years like 2006 saw minimal coverage, reflecting milder winters. This variability underscores the lake’s sensitivity to short-term climatic fluctuations and long-term changes in regional temperatures.
Current Average Comparison of Ice Coverage – Lake Ontario
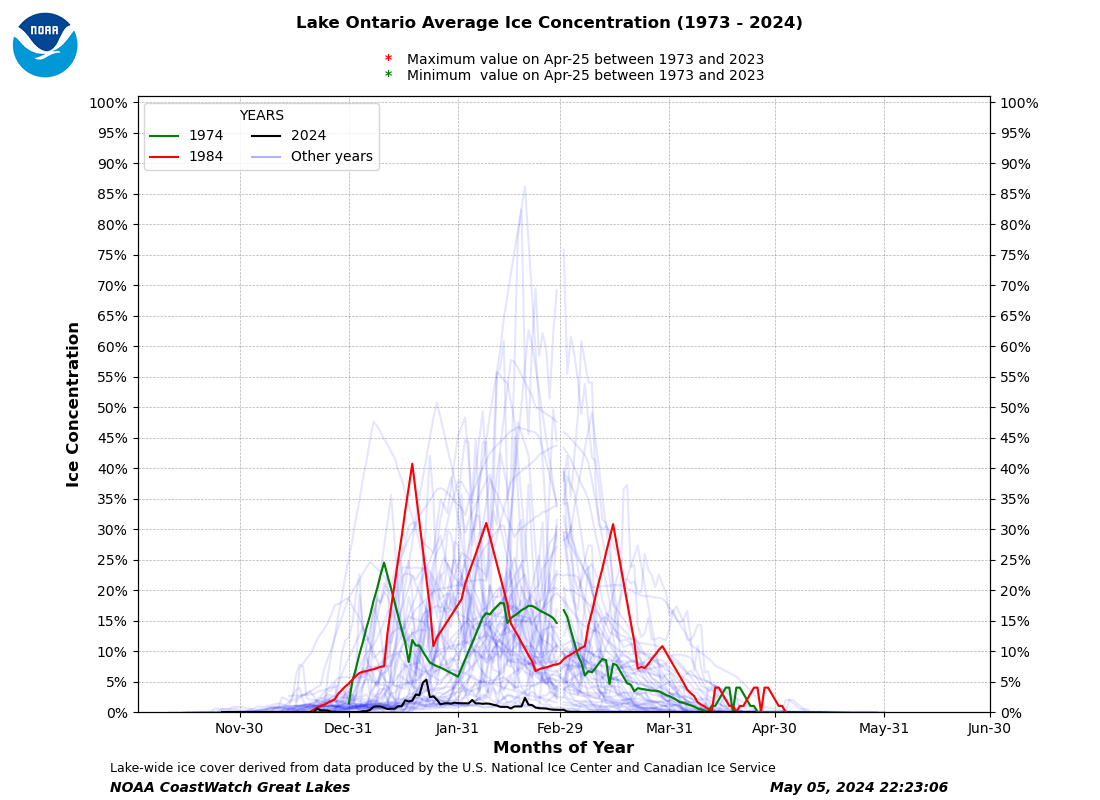
[lake_ontario_ice_coverage] The graph shows the average ice concentration on Lake Ontario from 1973 to 2025. It highlights individual years in blue, with specific years such as 1992, 2001, and 2025 prominently marked in green, red, and bold black, respectively. The data reveal that ice coverage typically increases in December, peaks in February, and decreases by April. Significant variability exists between years; some years show much higher peak concentrations ,while others remain low. The range of variation underscores the sensitivity of Lake Ontario’s ice formation to seasonal and climatic factors. Specific years like 1992 and 2001 align closely with long-term averages, whereas 2025 shows an unusual pattern, reflecting possible climatic anomalies or shifts.
June 24, 2026 – Current Ice Report
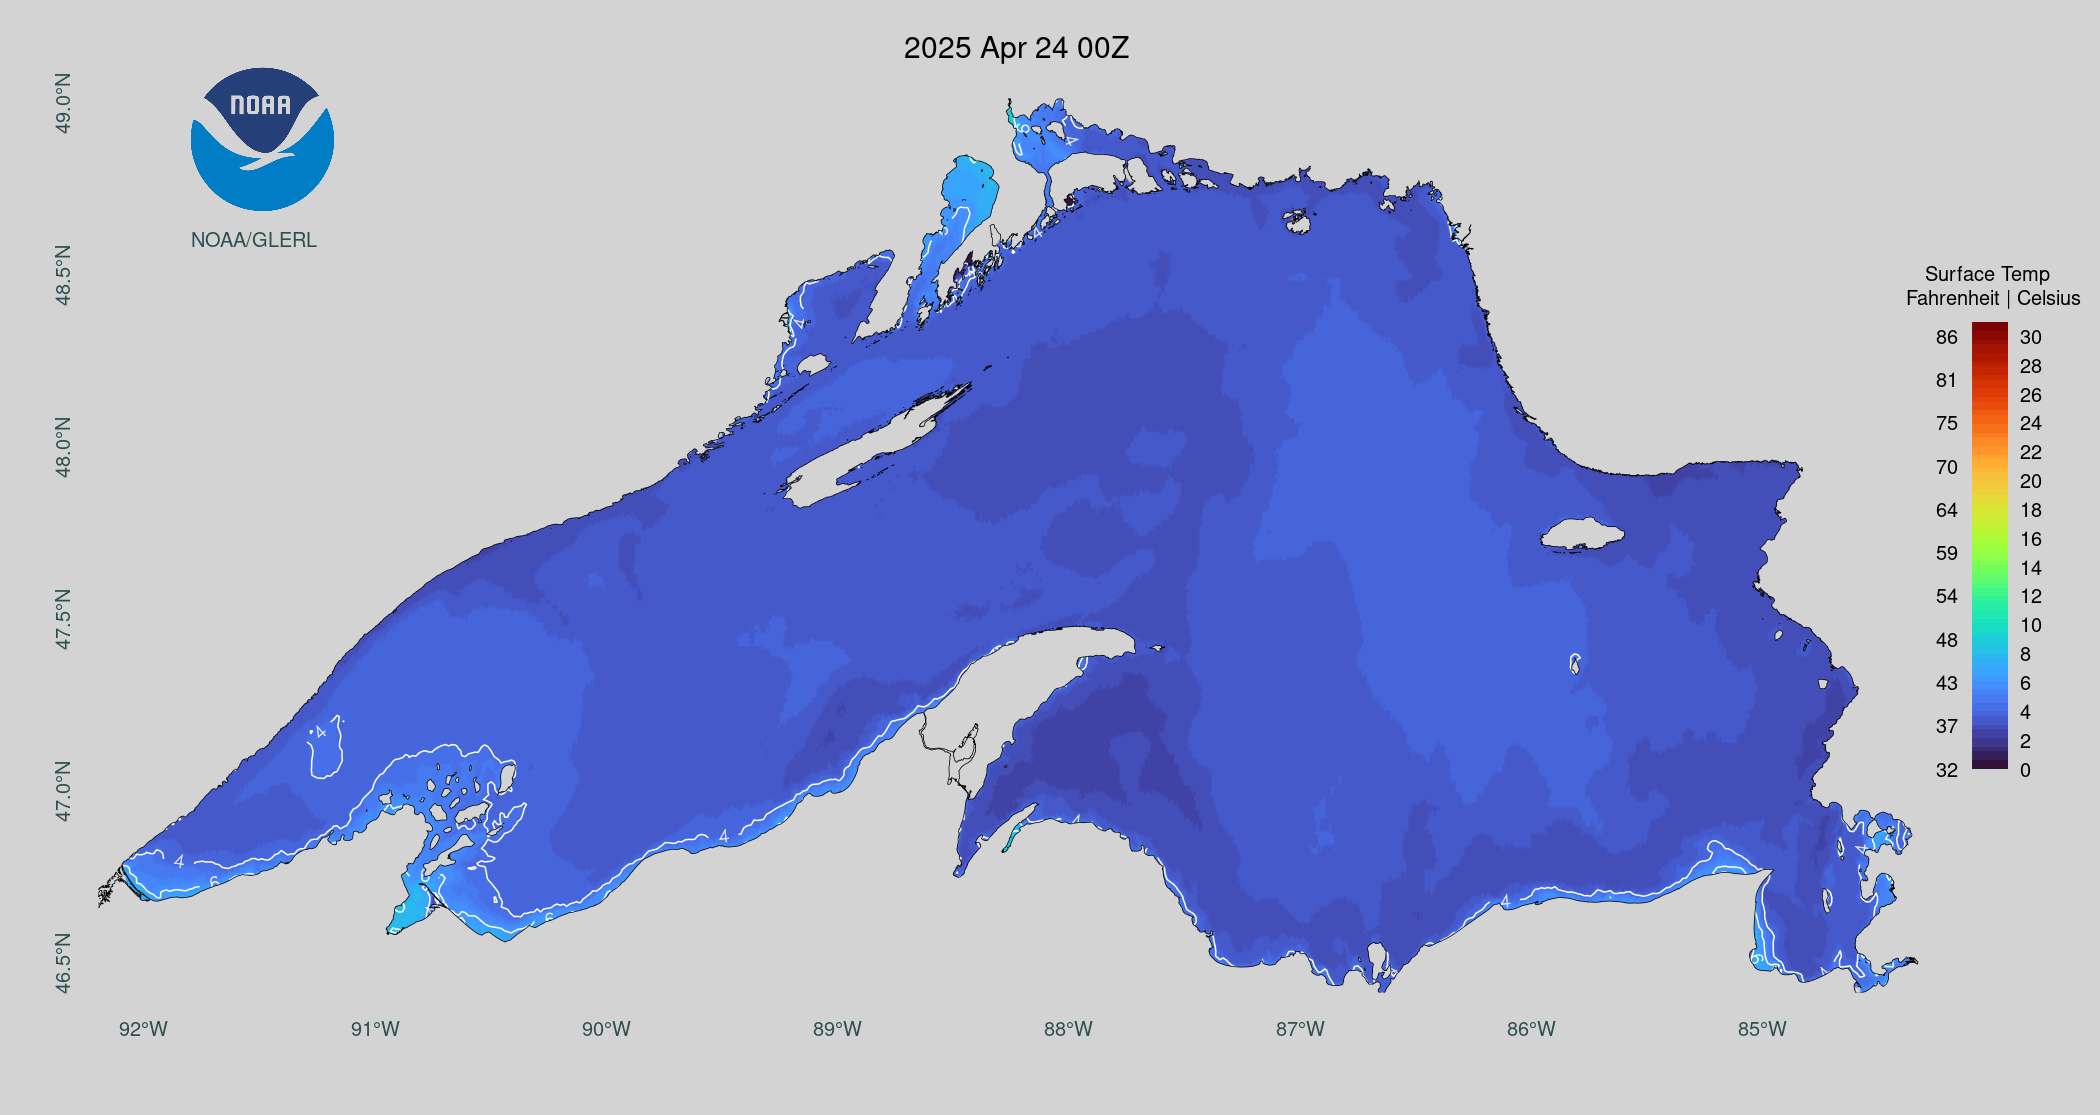
NOAA imagery shows water temperatures changing dynamically over the past few days in Lake Superior, Lake Michigan-Huron, and Lake Ontario, with its deep 800-foot waters.
Current Great Lakes Concentration & Thickness As Of – June 24, 2026

Lake Superior / Lake Michigan Observed Ice Coverage – June 24, 2026
Note: Images and Graphs Do Not Display If Data is Unavailable
Lakes Huron, St. Clair, Erie & Ontario Ice Coverage – June 24, 2026
Note: Images and Graphs Do Not Display If Data is Unavailable

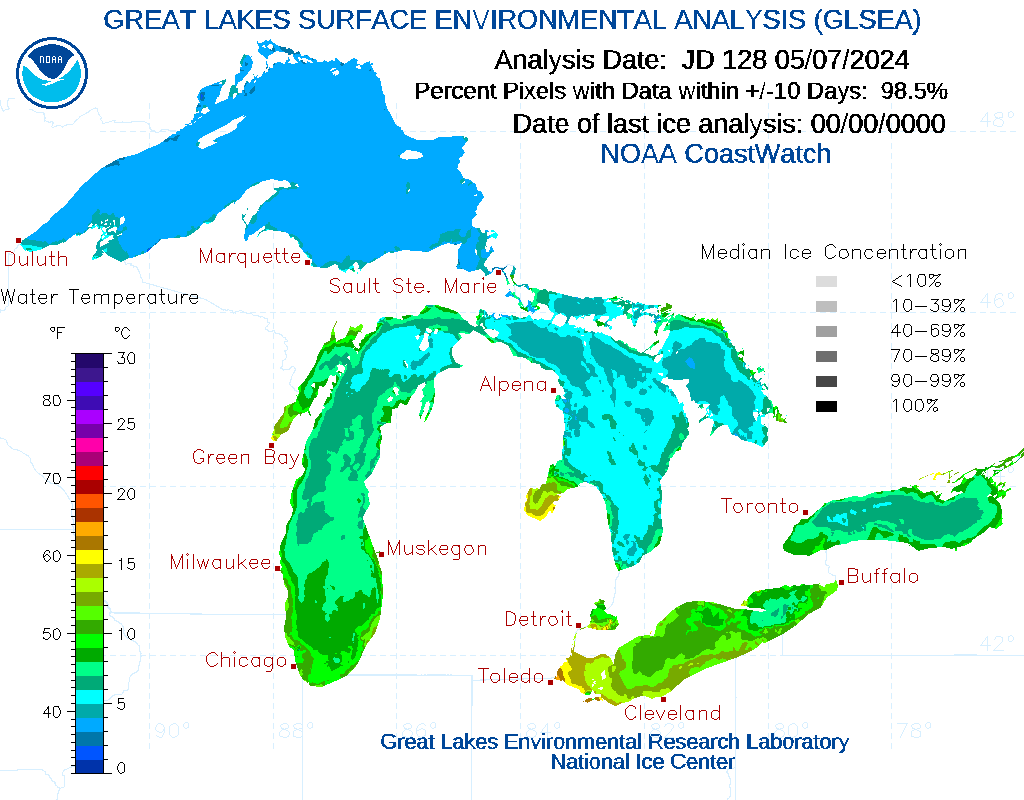
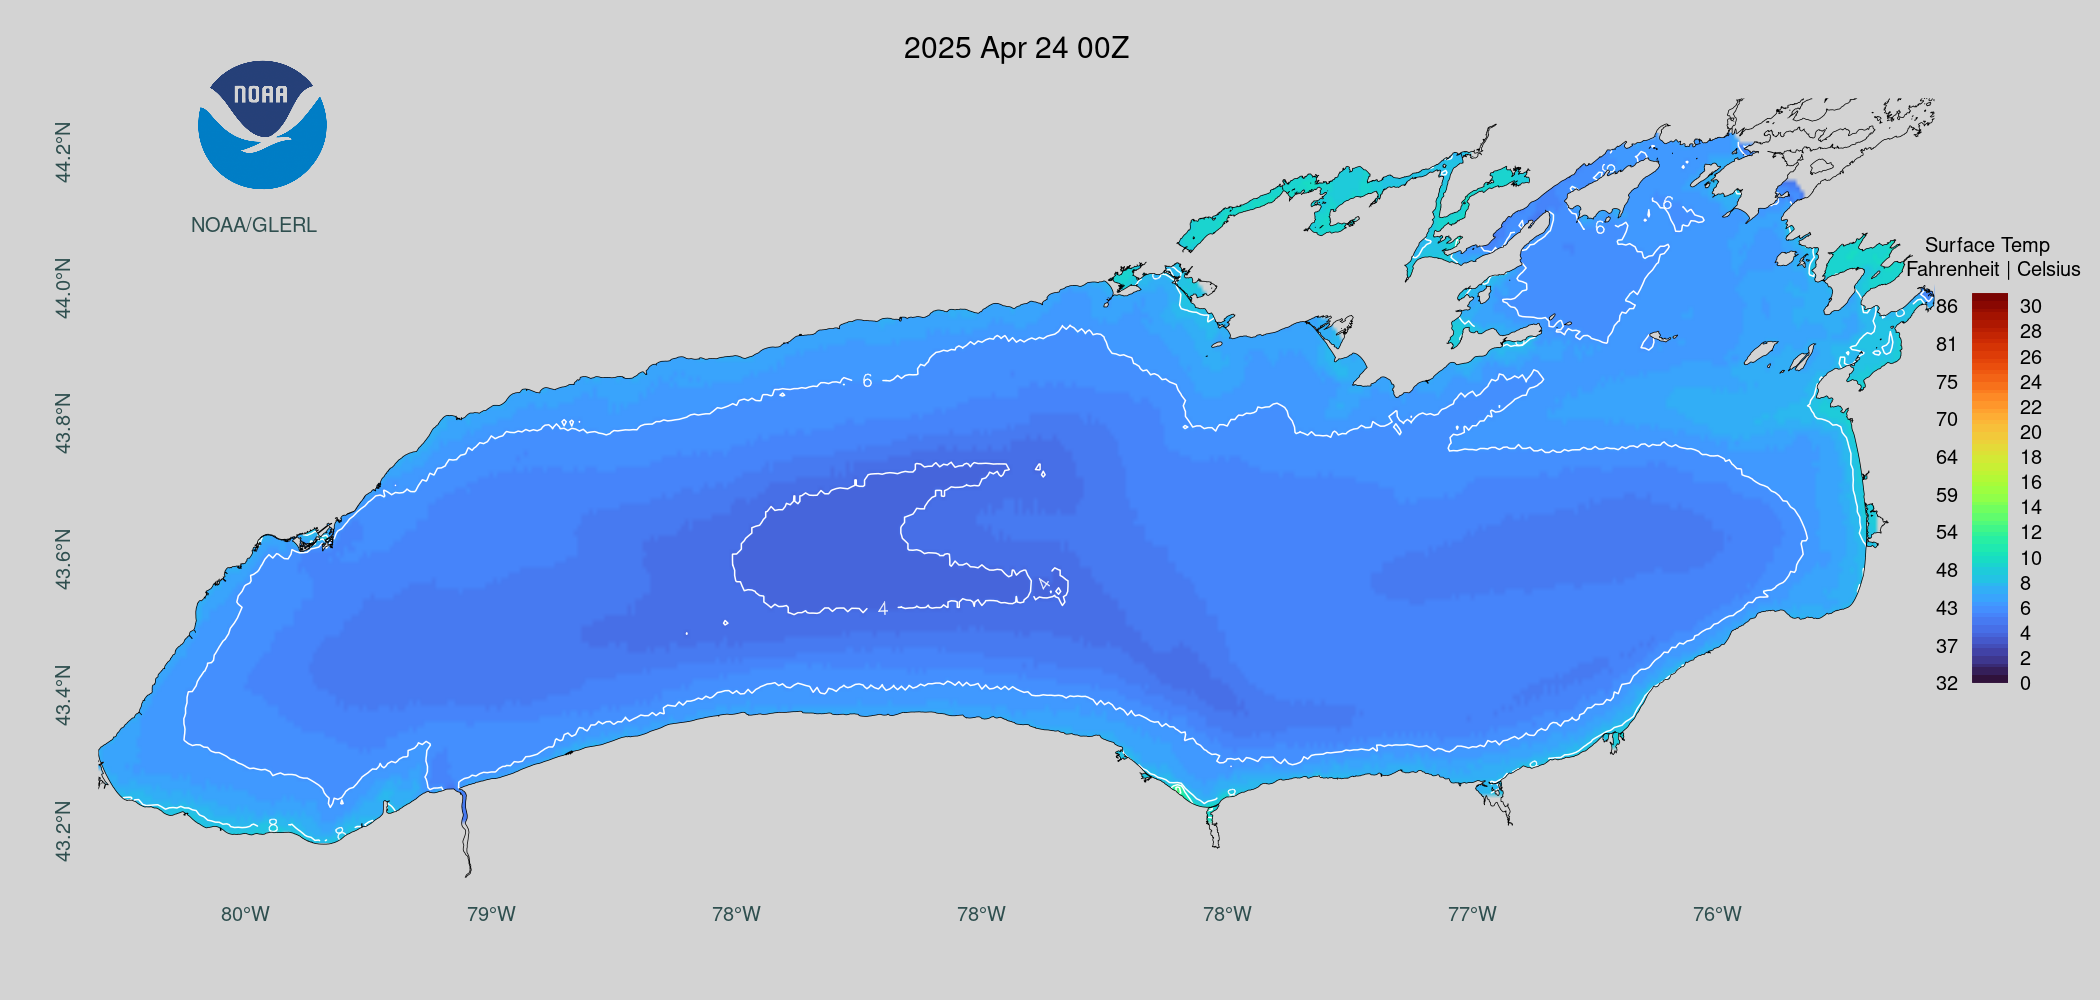
Great Lakes Water Temperature – Why Is It Important
Water temperature in the Great Lakes is vital for the environment, economy, and climate. Changes can impact fish spawning and migration, essential for healthy aquatic ecosystems and the fishing industry. Warmer lakes may also result in more intense winter snowstorms due to increased moisture. Elevated temperatures can lead to shoreline erosion and alter habitats for native species. Monitoring these trends is crucial for protecting the Great Lakes’ health and preparing for climate change impacts.. For more insights, NOAA’s Great Lakes Environmental Research Laboratory offers valuable data here.
[great_lakes_temperatures]
Lake Superior Surface Temperature – June 24, 2026
Lakes Michigan / Huron Surface Temperature –June 24, 2026
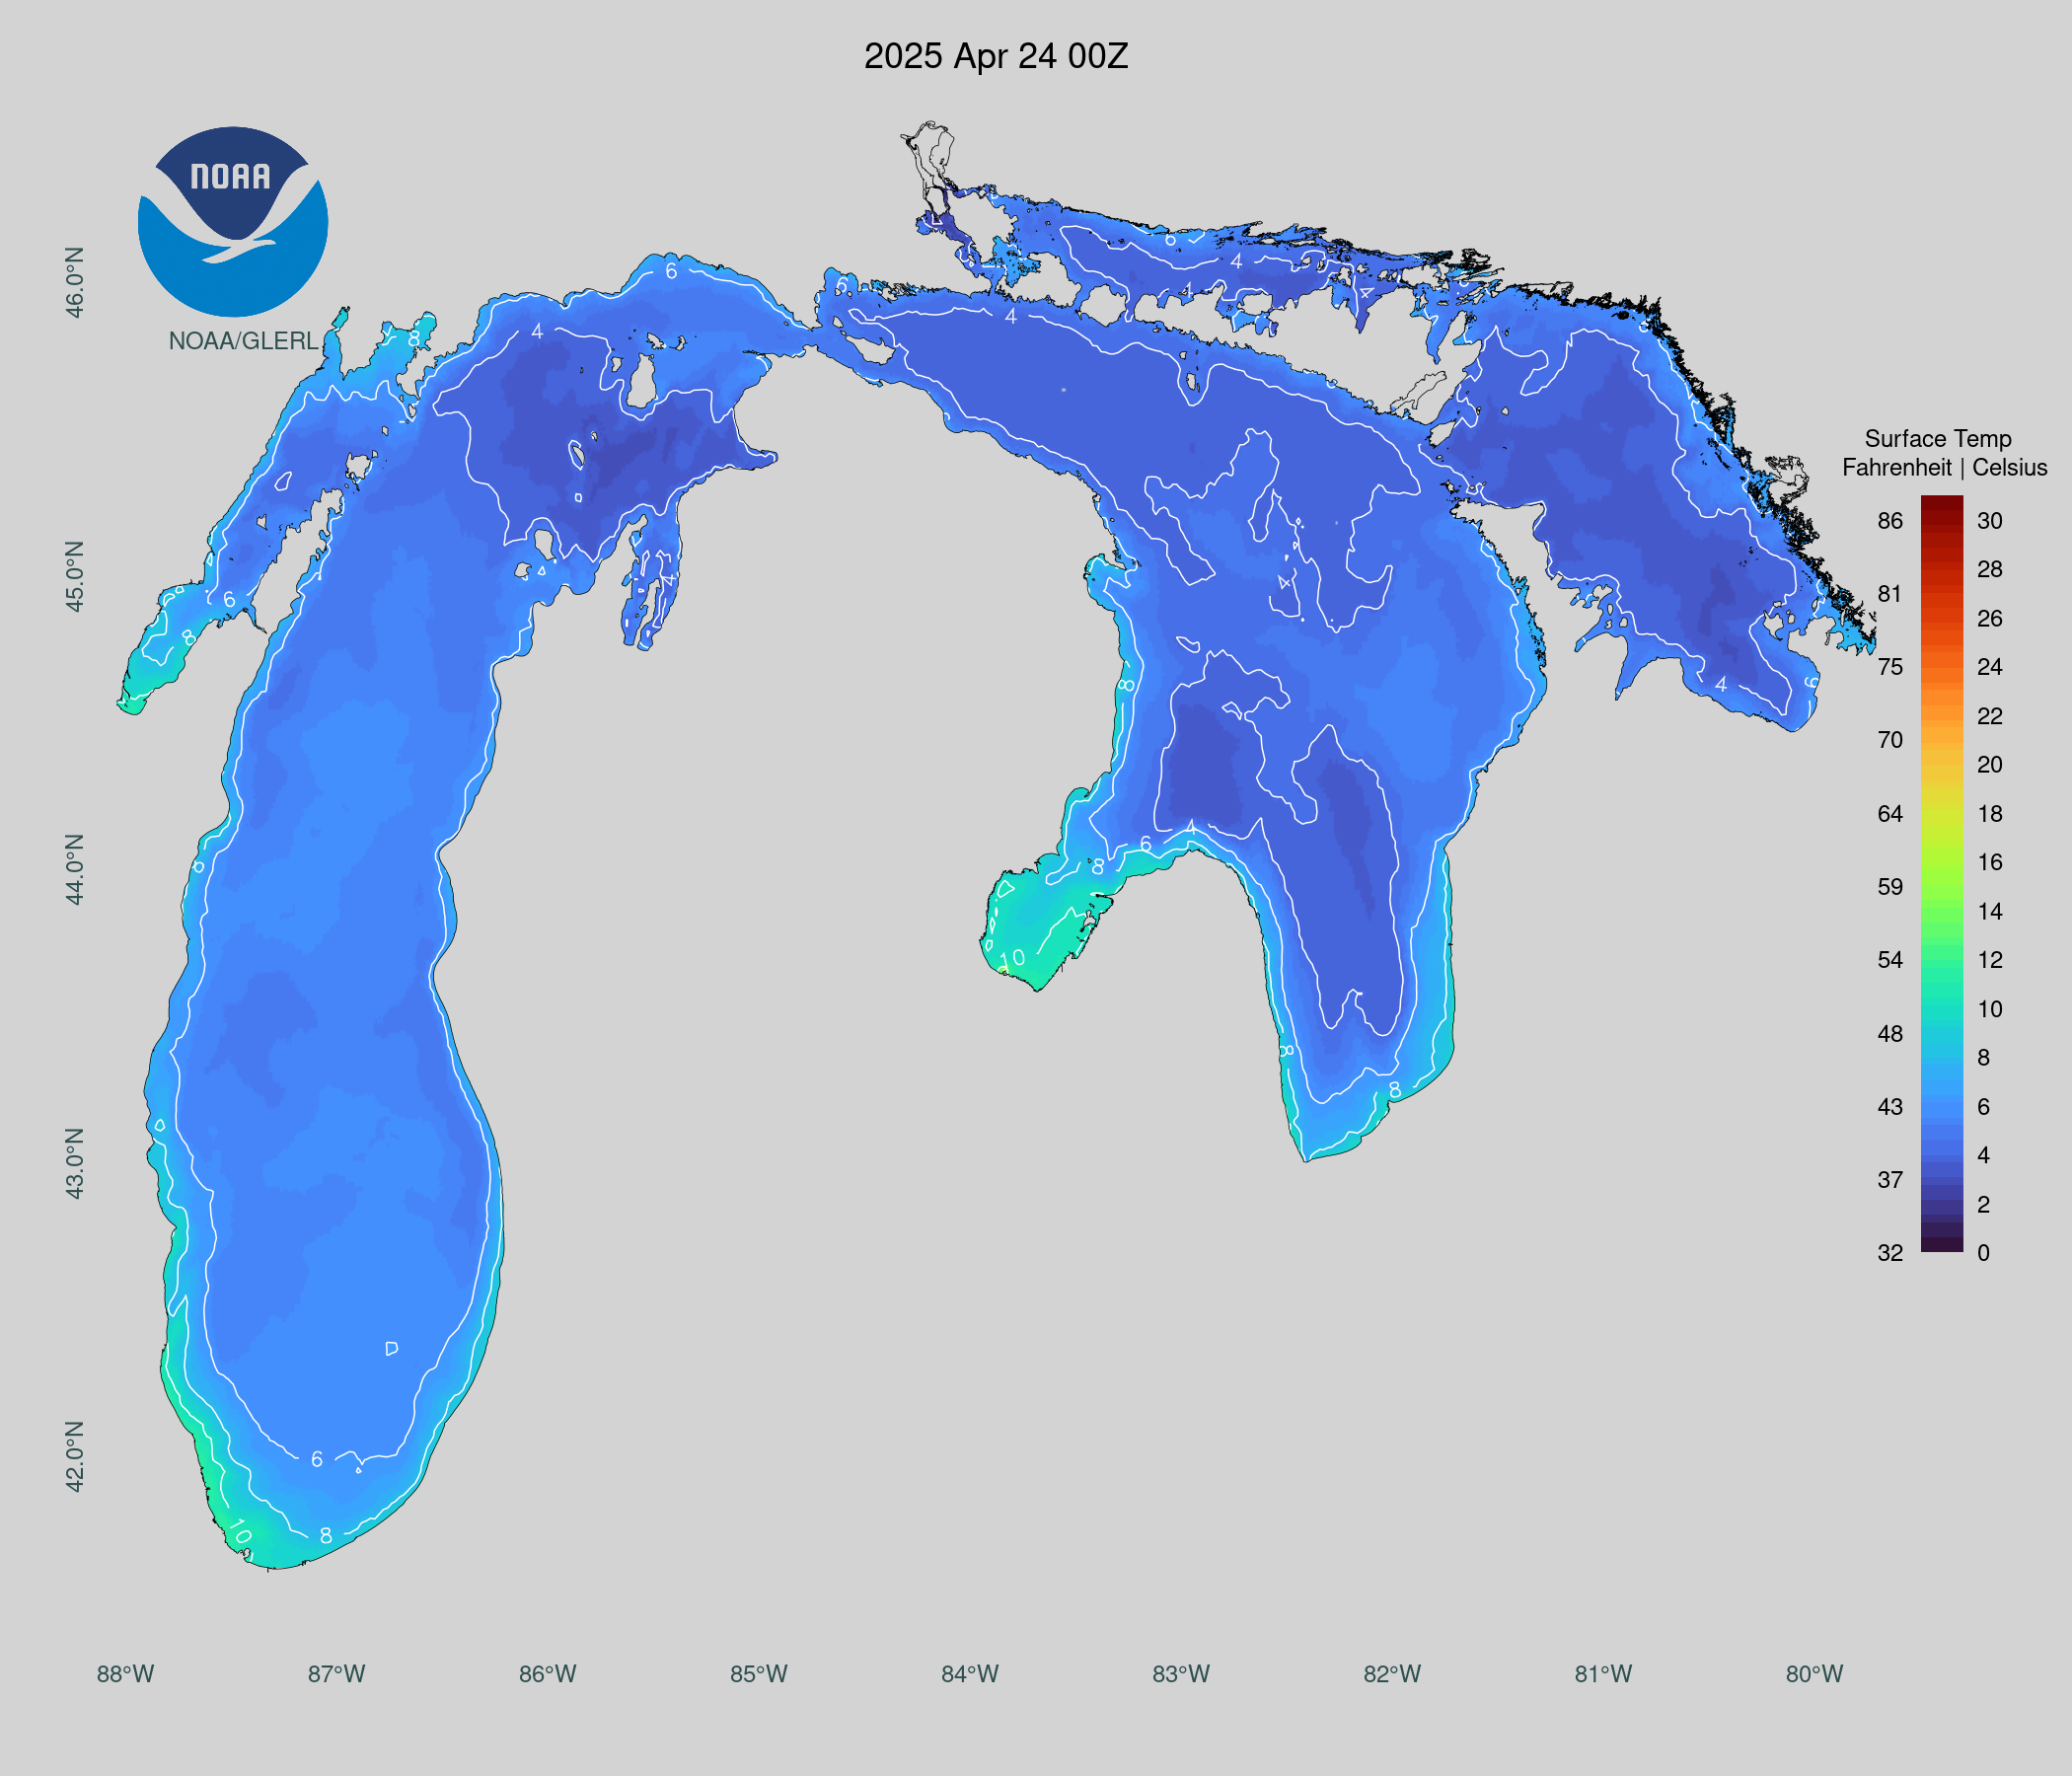
Note: Images and Graphs Do Not Display If Data is Unavailable
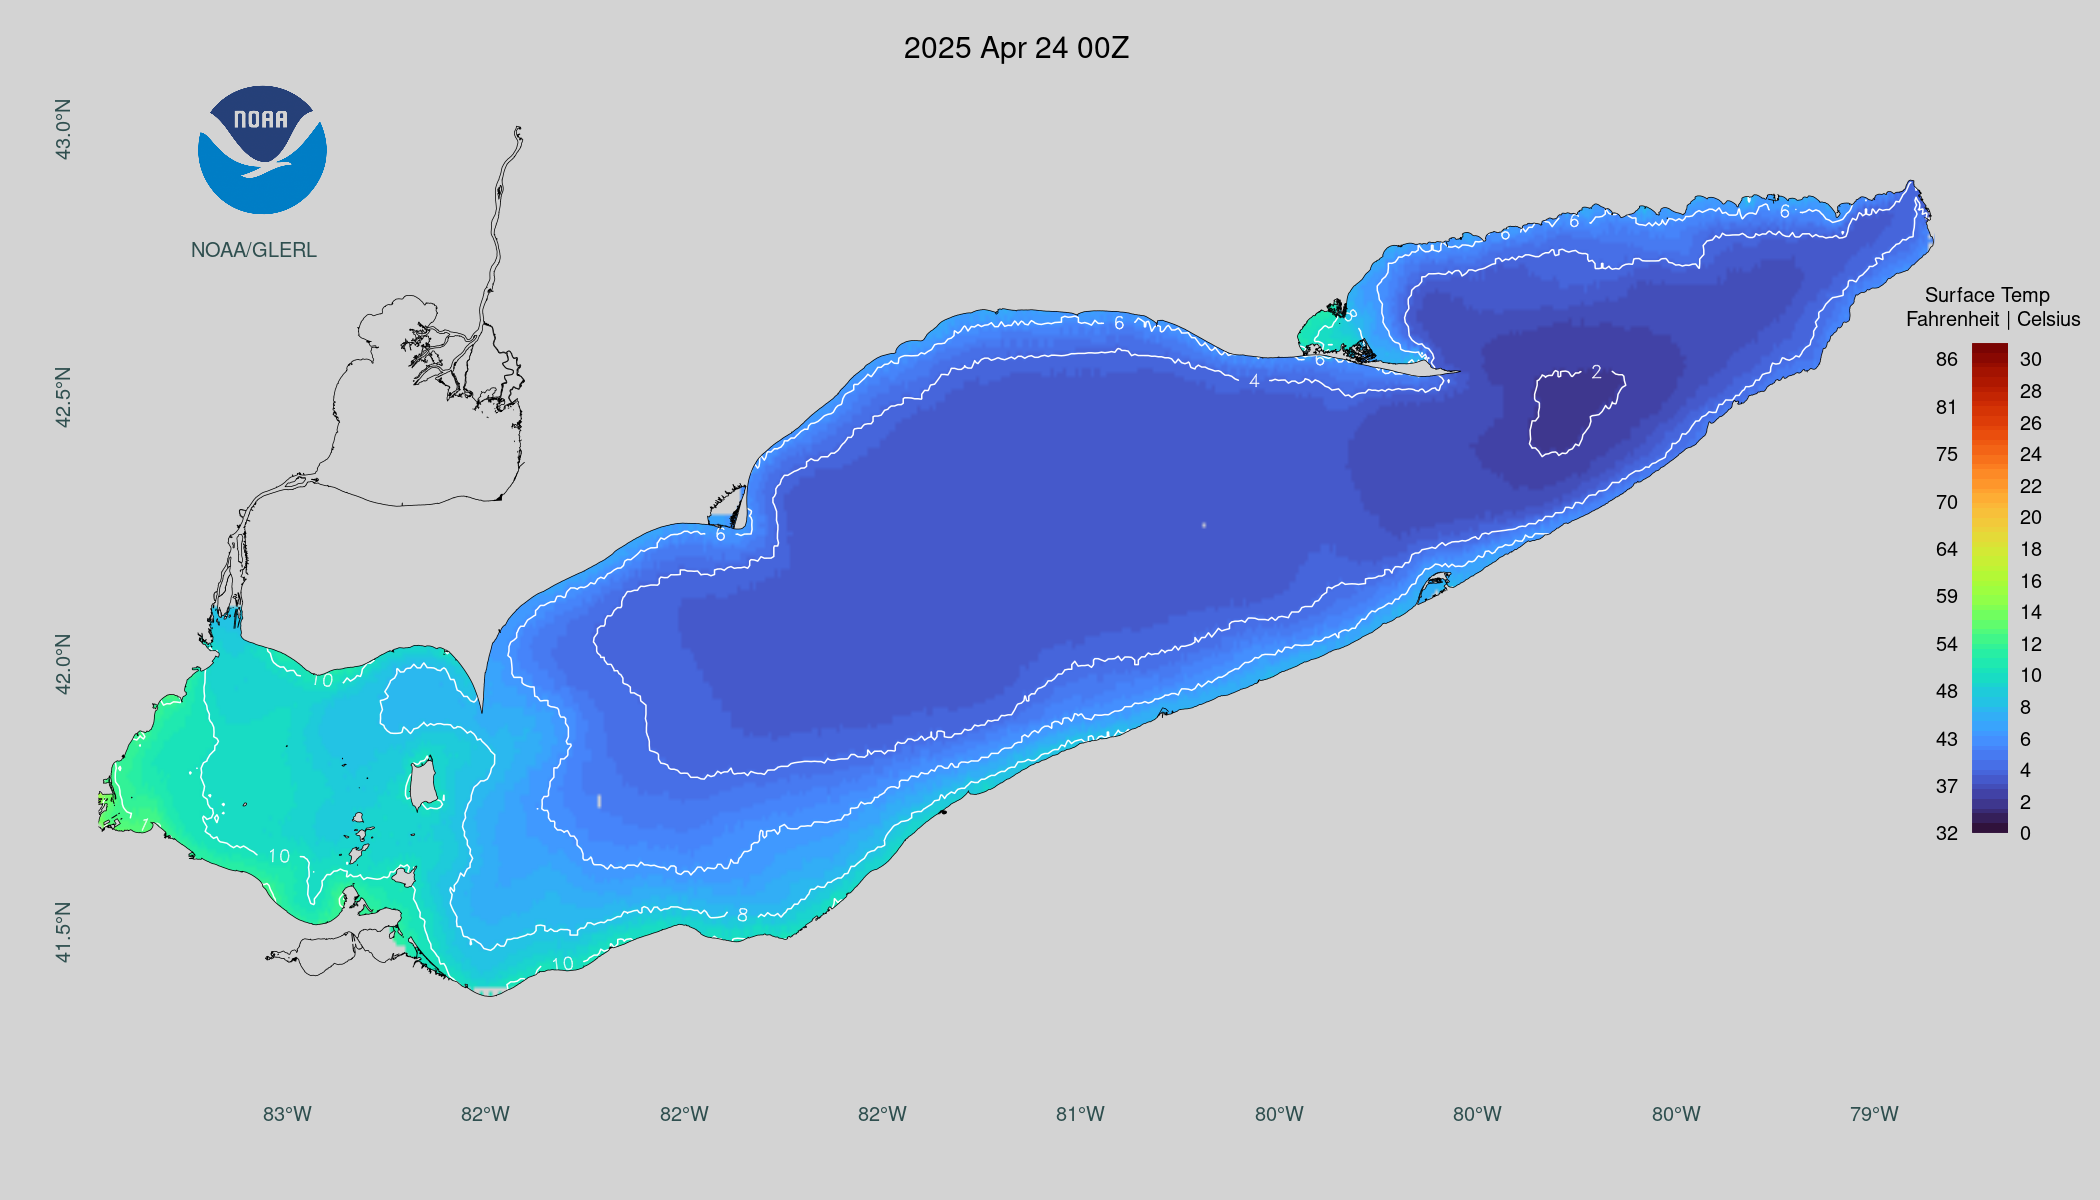
Lake Erie Surface Temperature –June 24, 2026
Lake Ontario Surface Temperature –June 24, 2026
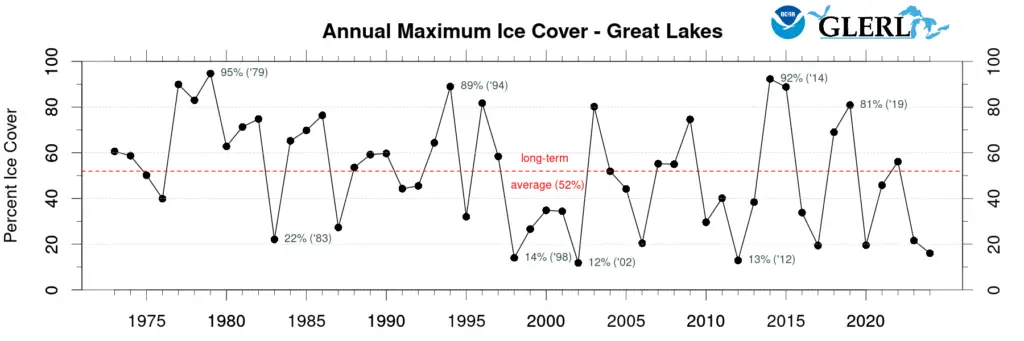
What is The Long Term Great Lakes Average Ice Coverage Rate?
The long-term average for maximum Great Lakes ice coverage is about 52%. This record high coverage rate for the Great Lakes was 94.7%, set in 1979. The record low ice coverage in the Great Lakes was 11.9% set in 2002 and 2013.
Great Lakes Ice Coverage History
Ice coverage data is from NOAA and is updated daily. Great Lakes water level data is reported monthly from the Army Corps of Engineers Detroit District.
What Does The Lack of Ice Coverage Mean?
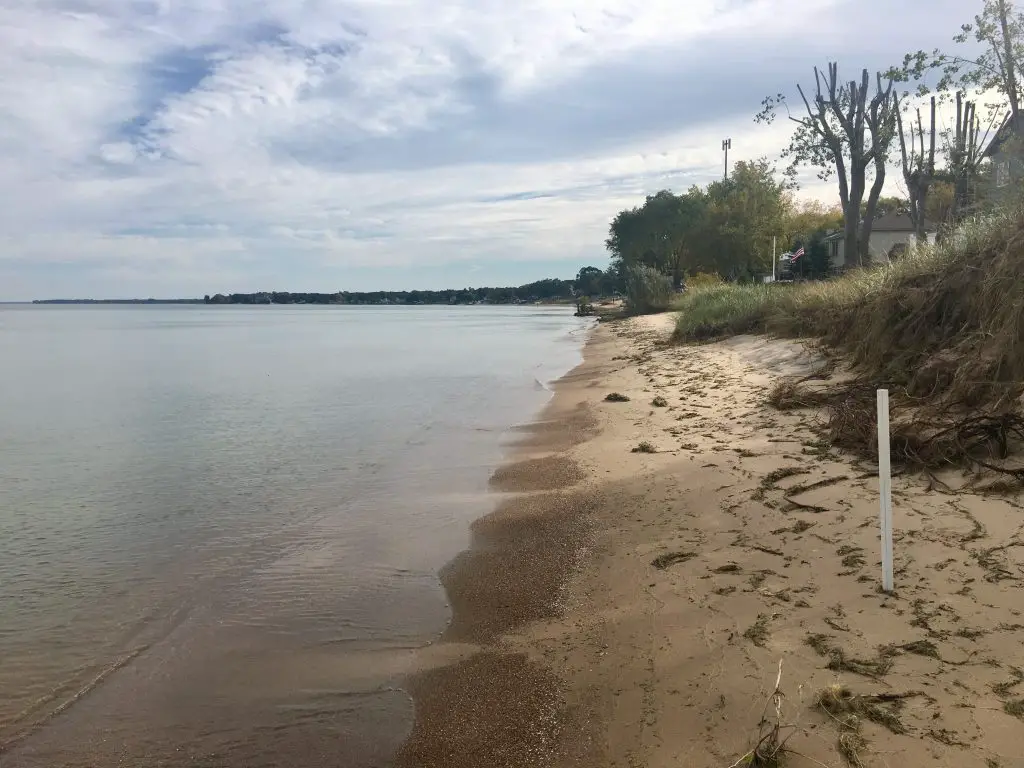
When the Great Lakes don’t freeze over, there is more evaporation. This puts moisture in the air, resulting in more cloudy, gray days across the region. If a cold snap does occur, accompanied by wind, the chance for heavy, localized lake-effect snow may occur. Due to higher-than-normal lake levels, beach erosion and lakeshore flooding may be more likely.
Forecast of Future Ice Coverage with Climate Change
One study from 1991 hinted that increased CO2 levels across the Great Lakes region would lower ice coverage. Data from 30 years were extrapolated using various CO2 increases. The potential environmental and socioeconomic impacts of increased CO2 warming include year-round navigation, a change in the abundance of some fish species in the Great Lakes, discontinuation or reduction of winter recreational activities, and an increase in winter lake evaporation.
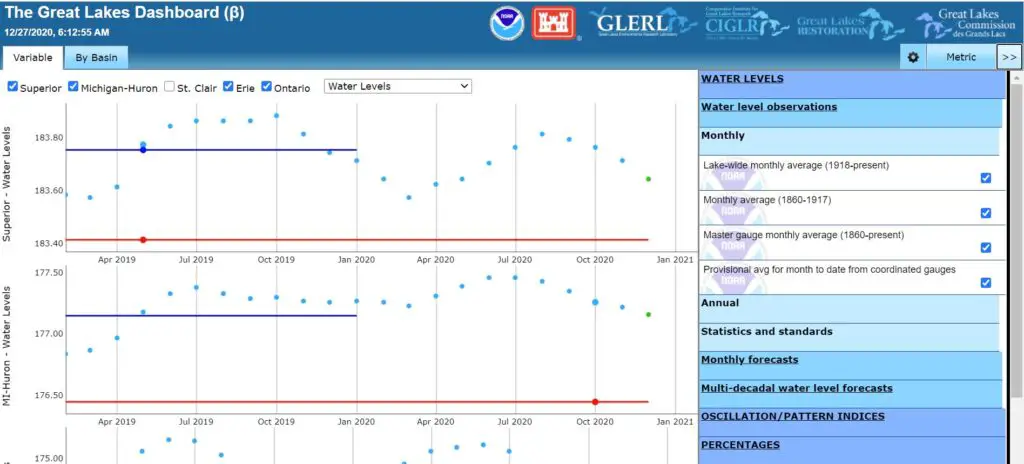
Current Great Lakes Water Level Report
The report below is interactive and you can control the display. Click on the image to access the dashboard in a new tab.
The Detroit Army Corps of Engineers has kept records of Great Lakes ice coverage going back to 1973. The map shows the extent of the maximum ice cover on the Great Lakes for each year. Data is from the U.S. National Ice Center and the Canadian Ice Service. Satellite data is combined with other sources to translate daily ice charts into a percent cover pixel grid.
It is sporadic for all the Great Lakes to freeze over entirely. Yet they experience substantial ice coverage, with large sections of each lake freezing over in the coldest months. During the winter of 2013-2014, frigid temperatures covered the Great Lakes and the surrounding states. The persistent cold caused 91 percent of the Great Lakes to be frozen by early March 2014. This resulted in late winter of freezing temperatures but sunny clear days and nights.
Impact on 2024 Great Lakes Water Levels
Ice cover will lessen the impact of evaporation on the Great Lakes due to less exposure to the air. It also could lower the amount of lake effect snowfall in the region. Cold temperatures in early January will be a strong indicator that the Great Lakes will approach total ice coverage in the spring of 2020. A high ice coverage rate will likely mean higher record-setting Great Lakes water levels in the summer of 2020.
Ice Tsunami Destroys Homes Along Great Lakes Shoreline
This shows the power of water and ice when a little wind gets behind an ice flow near shore.
Related Great Lakes Ice Coverage and Water Level Reporting
In the winter of 2018, there were two deaths and one rescue on the Saginaw Bay ice in the Upper Thumb in early February. Each year we are sent reports of rescue and recovery of those who snowmobile or ice fish on the Great Lakes. We found a short video that describes the steps to survive falling through ice even if you can’t get yourself out of the water. It’s a fight for survival. How to Survive Falling Through the Ice

Great Lakes winters can be brutal. Getting your car ready for winter is critical. Winter will be colder and drier than normal, with the coldest temperatures in mid-to-late November, through greatest in December and January, and in early to mid-February. Snowfall will be near average in the region, although a few places south of the Great Lakes will have much-above-normal snowfall. The recent cold snap in 2021 means more snow and ice for the rest of the winter. Four Ways to Get Your Car Ready for Winter

Five years ago, the entire Great Lakes was witness to low water levels not seen since 1964. Marina’s were dredging; boats were being damaged on shallow reefs not seen a generation, and lake shipping was facing hard times. There was serious concern about how far it would go and what would happen next. A Look Back – 2012 Marina’s Scramble as Water Levels Dropped

A look back at Great Lakes water levels. Reports and estimates from a November 2019 update from the Army Corps of Engineers Detroit District pointed to an outlook that meant the Great Lakes would continue to rise and break records in 2020. 2020 Great Lakes Water Levels Look to Break Records

We take updates each month from the Army Corps of Engineers’ extensive reporting and summarize on a single page each month. We break down reports for each of the five Great Lakes and include an extensive three-year estimated forecast of water levels. We also include historical data and analysis for researchers. It’s one of our most-read pages on Thumbwind. Excepts – Detroit District’s Monthly and Weekly reports for Great Lakes Water Levels and Great Lakes Water Level History. 2021 Great Lakes Current And Historical Water Levels
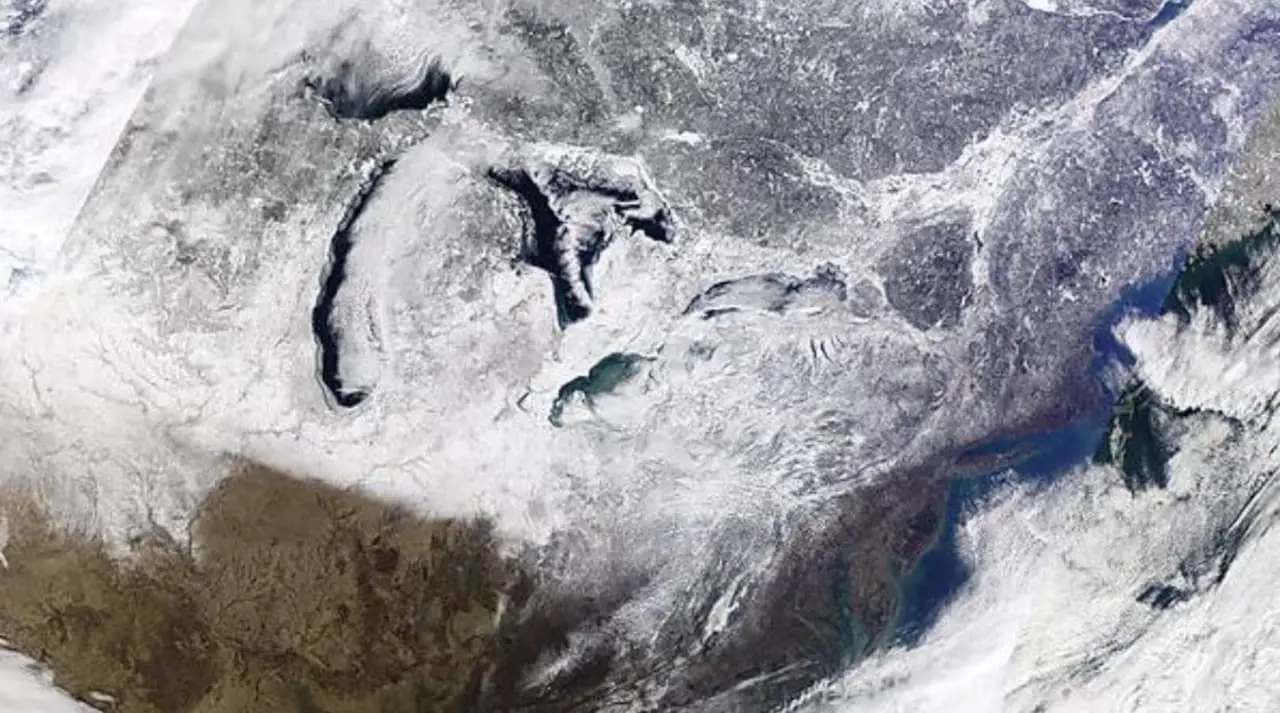
Cover Photo by NASA on Unsplash