
Each month we summarize reports and data from the Army Corps of Engineers – Detroit District’s Monthly and Weekly reports for Great Lakes Water Levels and Great Lakes Water Level History. We present a single-page view of the changes in lake levels from month to month are presented for Lakes Huron-Michigan, Lake Superior, Lake Erie, Lake Ontario, and Lake St. Clair.
Table of Contents
Great Lakes Basin Weather Conditions Over the Past Month Affecting Water Levels
The Great Lakes basin experienced unusually warm temperatures, up to 12°F above normal, as of March 15th. Many places saw daily highs around 70°F at the start of the week, offering a hint of spring. However, these high temperatures were followed by wet weather later in the week, as most of the region saw rainfall on Friday and Saturday. Lake Superior got the least amount of rain, with only two-tenths of an inch, whereas other parts of the Great Lakes basin received as much as an inch and a half. Moving into the weekend, the temperature will return to seasonal averages across the basin. Rainfall is expected in the central and eastern regions over the weekend, while the northwest may see a mix of rain and snow.
Outflow Estimates Affecting Great Lakes Levels
In March, the outflow of Lake Superior into the St. Marys River is anticipated to be around average. The St. Clair River’s outflow from Lake Michigan-Huron and the Detroit River’s outflow from Lake St. Clair are expected to be higher than average. Similarly, above-average outflows are projected for the Niagara River from Lake Erie and the St. Lawrence River from Lake Ontario.
Weather Impact
Observations as of May 12, 2023 – Last weekend through Wednesday, the weather in the Great Lakes area was typical for this time of year. The warmest day was Sunday, with temperatures soaring above 80 degrees Fahrenheit in cities like Chicago, IL, Fort Wayne, IN, and Detroit, MI. Aside from 1.1 inches of rain in Sault Sainte Marie, MI, and 1.5 inches in Fort Wayne, IN, over the weekend, there wasn’t a lot of rain in the Great Lakes area over the past week.
This coming weekend, most of the Great Lakes region will start off warmer than usual, with high temperatures reaching the upper 70s on Friday. But by Sunday and continuing into the early part of next week, temperatures will be near or slightly below the usual for this time of year. Duluth, MN, is the exception where the temperature could near 80 degrees on Monday. Rain showers are expected in the southern part of the Great Lakes region on Friday.
Compared Log Term Avderages Lakes Michigan-Huron, St. Clair, Erie, and Ontario Are Higher, Lake Superior is Lower
The water level forecasts for March 15th indicate a one-inch rise in Lakes St. Clair and Ontario compared to February, while Lakes Erie and Superior are expected to be one and two inches lower, respectively. Lake Michigan-Huron’s water level is anticipated to stay consistent with its previous measurement. However, all the lakes’ projected levels for March 15th are lower than the same time last year, with Lake Superior showing the biggest difference at eight inches below.
Compared to their long-term averages, Lakes Michigan-Huron, St. Clair, Erie, and Ontario are higher, except for Lake Superior, which is projected to be lower. St. Clair and Erie have the highest differences, being eleven and twelve inches above their long-term averages, respectively. Looking ahead, April predictions suggest a rise of two inches for Lakes Michigan-Huron and St. Clair, a three-inch rise for Erie, and a five-inch rise for Ontario, while Superior’s level is expected to remain constant. For more information on water levels, visit our Daily Levels web page.
Great Lakes Hydrographs
On the hydrographs, monthly mean water levels for the prior year and the current year are depicted as a solid line. A dashed line represents a forecast over the following six months. This forecast is based on the current state of the lake basin and forecasted future weather. The shaded region depicts a range of probable values during the following six months based on weather changes. Current and forecast levels (solid and dashed lines) can be compared to the 1918-2021 average and extreme values (dotted lines) (shown as bars with their year of occurrence). The legend below identifies the information on the hydrographs in further detail.
Daily Great Lakes Water Level Report
Lakes Michigan-Huron Water Levels Remain Slightly Above Average
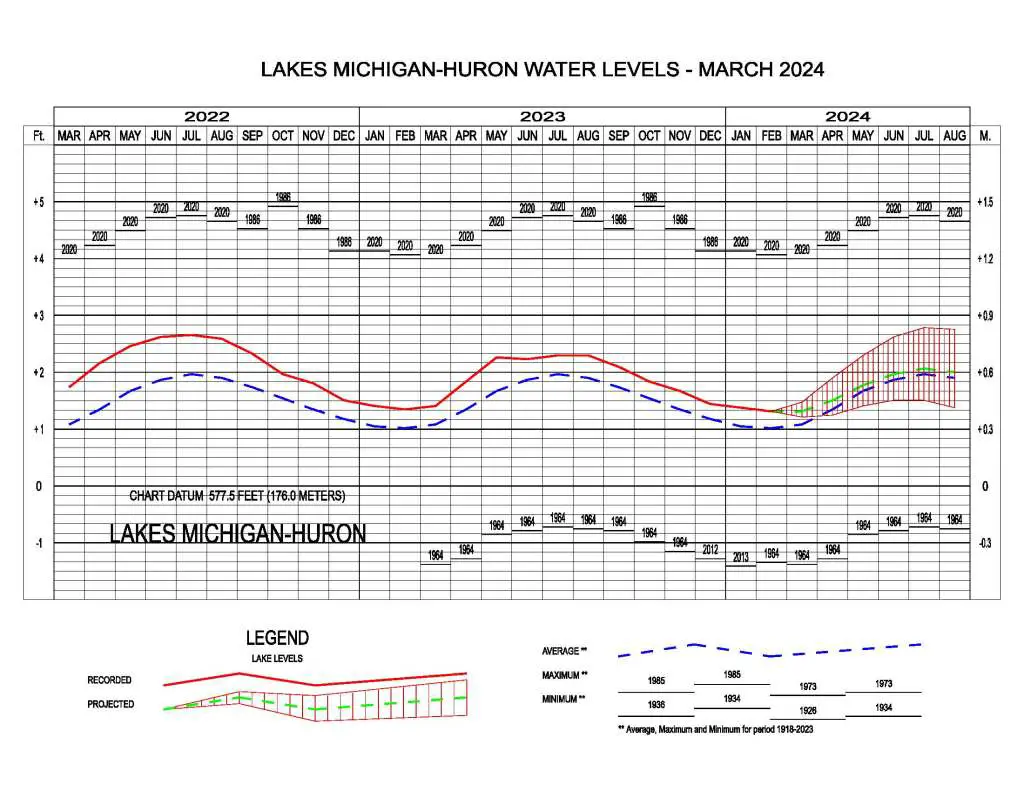
Current Month’s Water Levels for Lakes Michigan-Huron
Lake Michigan-Huron is holding steady with its water level. The average water level had no change from February to March, reaching 579.27 feet. This March average was 3 inches higher than the Long Term Average (LTA) for March, 1 inch lower than the level in March 2023, and 32 inches lower than the record high for April set in 2020.
Lake Michigan-Huron’s water level, following its seasonal trend, fell from January to February, with its monthly average decreasing by an inch to 578.74 feet. Although this is 4 inches higher than its Long-Term Average (LTA) for February, it is close to its level in February 2023 and 33 inches lower than its record high in February 2020. The Lake received more water than average for the third month in a row. The forecast suggests that the Lake’s level in March will be similar to its current level, and then it will start its seasonal increase, which is expected to continue until July. Between March and August, the water levels of Lake Michigan-Huron are anticipated to be 1 to 6 inches lower than last year, 32 to 33 inches below the highest recorded levels, but still 1 to 3 inches above the LTA.
Lakes Michigan-Huron is expected to stay at or slightly above its long-term monthly mean water level well into 2024.
Lake Superior Water Level Dips Below Average
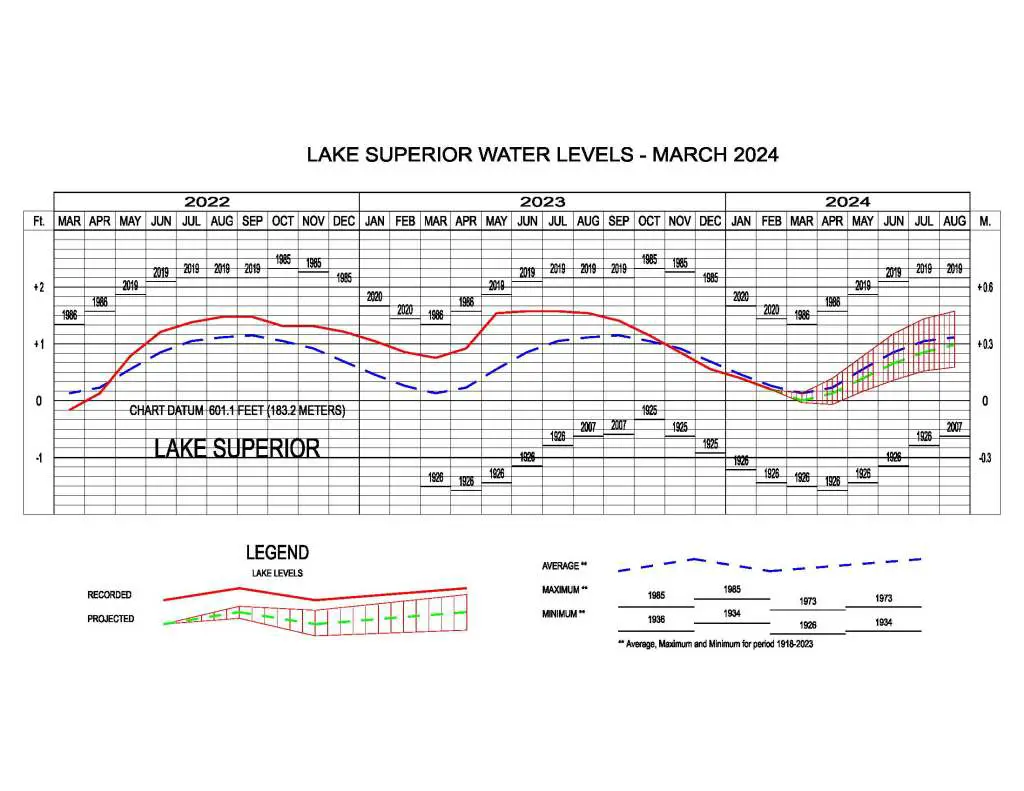
Current Month’s Water Level For Lake Superior
Lake Superior actually reduced its water level in March. The average water level for the month dropped 2 inches from February to reach 601.10 feet. This level was 1 inch lower than the Long Term Average (LTA) for March, 8 inches lower than the level in March 2023, and 16 inches lower than the record high for March.
From January to February, Lake Superior’s seasonal decline continued, with its average monthly level falling 2 inches to 601.25 feet. This was 1 inch lower than the historical average for February, 8 inches lower than the February level of the previous year, and 15 inches lower than the record high for February set in 2020. The lake received below-average water supplies in February, likely due to lower than average precipitation and higher than average evaporation around Lake Superior. The current 6-month water level bulletin predicts that Lake Superior will continue its seasonal decline into March, followed by a seasonal increase. Projected water levels from March to August are expected to be 7 to 14 inches lower than last year, 14 to 18 inches lower than record highs, and 1 to 2 inches lower than the long-term average.
Lake Superior is expected to stay at or slightly below its long-term monthly mean water level well into 2024.
Lake St. Clair Water Level Remains Above Average
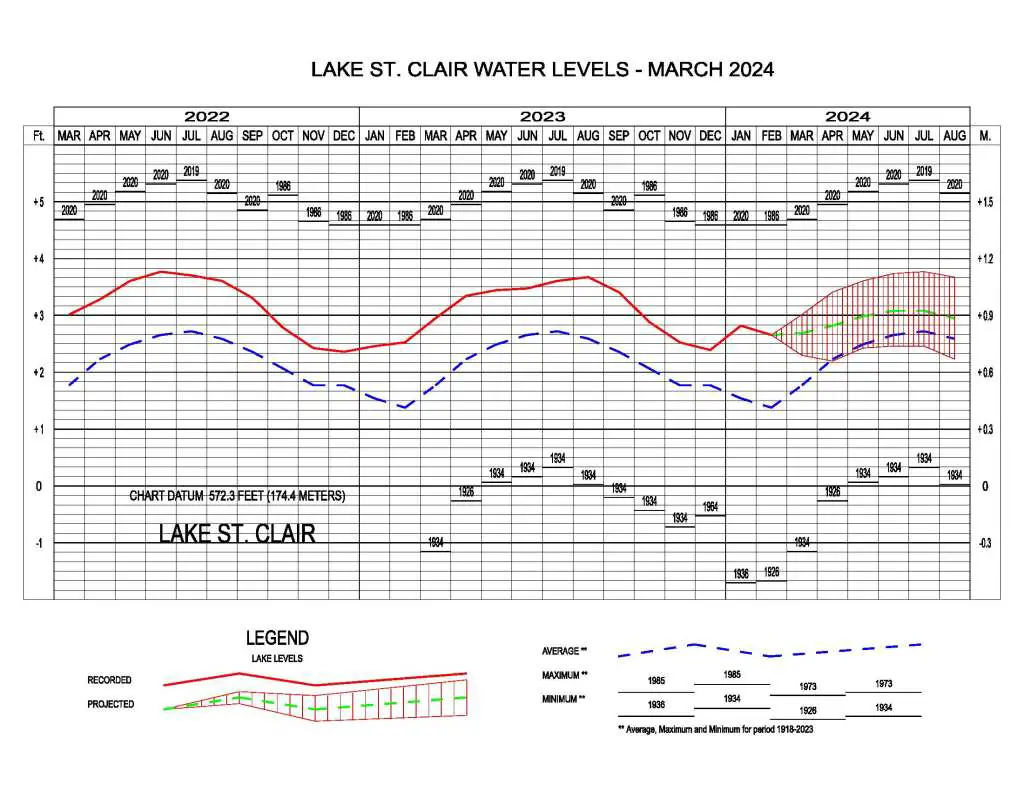
Current Month’s Water Level for Lake St. Clair
In March, Lake St. Clair continued its usual seasonal increase, rising 1 inch from February. The average water level for the month was 572.3 feet. This level was 2 inches higher than March last year, 11 inches above the long-term average for April, but still 24 inches below the record high set in 2020.
From January to February, Lake St. Clair experienced a seasonal decrease, with its average monthly level falling by 2 inches to 574.84 feet. This level was 15 inches higher than its Long Term Average (LTA) for February, 2 inches higher than its level in February 2023, and 23 inches lower than its record high in February 1986. Forecasts for the next 6 months indicate that the water level in Lake St. Clair is expected to increase, peaking around June or July. Between March and August, the water levels are predicted to be 3 to 9 inches lower than the previous year, 24 to 28 inches lower than the record high, but 4 to 11 inches higher than the LTA.
Lake St. Clair is expected to stay above its long-term monthly mean water level well into 2023.
Lake Erie Water Level
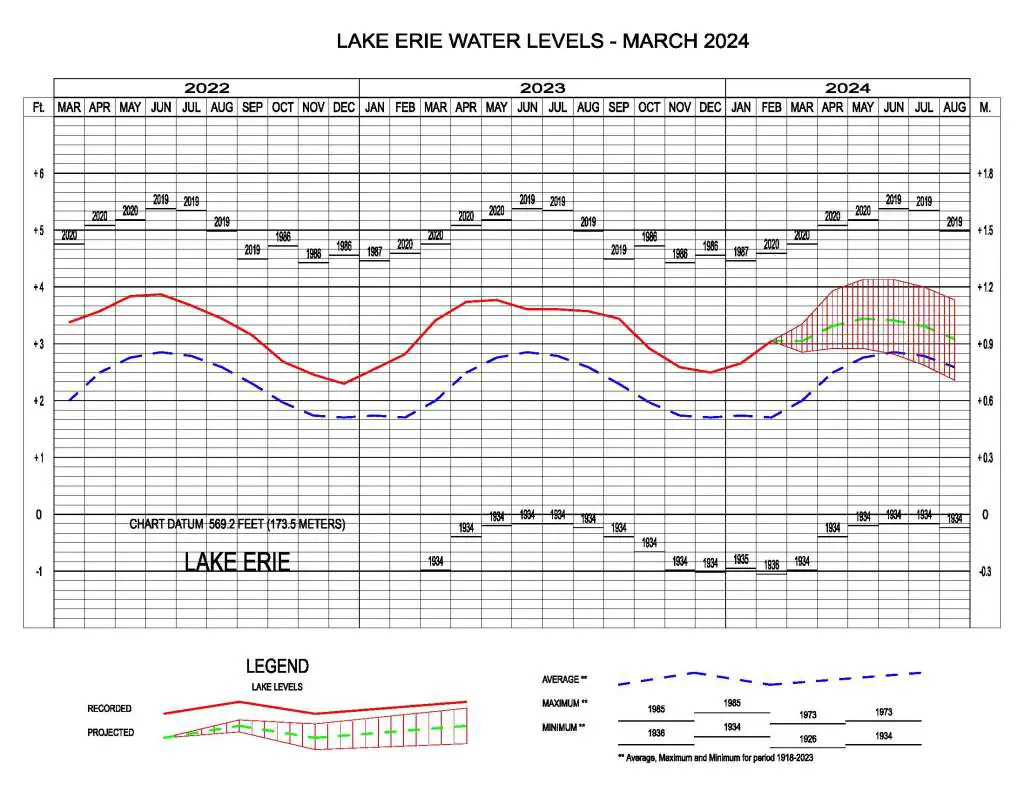
Current Month’s Water Level for Lake Erie
In March, Lake Erie’s water levels continued to drop. The average water level for the month was 569.2 feet, 1 inch lower than in February. This level was also 12 inches above the Long Term Average (LTA) for March, 5 inches below the level from last year, but 21 inches below the record high set in 2020.
From January to February, the average monthly level of Lake Erie increased by nearly 5 inches, reaching 572.28 feet. This was 16 inches higher than the February Long-Term Average (LTA) level, 3 inches higher than the previous February, and 19 inches lower than the record February level in 2020. Lake Erie’s February precipitation was approximately 30% of the average, significantly impacting the water supplies*, which were considerably lower than the usual February average. The latest 6-month forecast anticipates that Lake Erie’s level will continue to rise seasonally until May. Between March and August, the water levels in Lake Erie are expected to be 2 to 6 inches lower than those of the previous year, 20 to 24 inches lower than the record highs, but 6 to 13 inches higher than LTA levels.
Lake Erie is expected to stay slightly above its long-term monthly mean water level well into 2024.
Lake Ontario Water Level
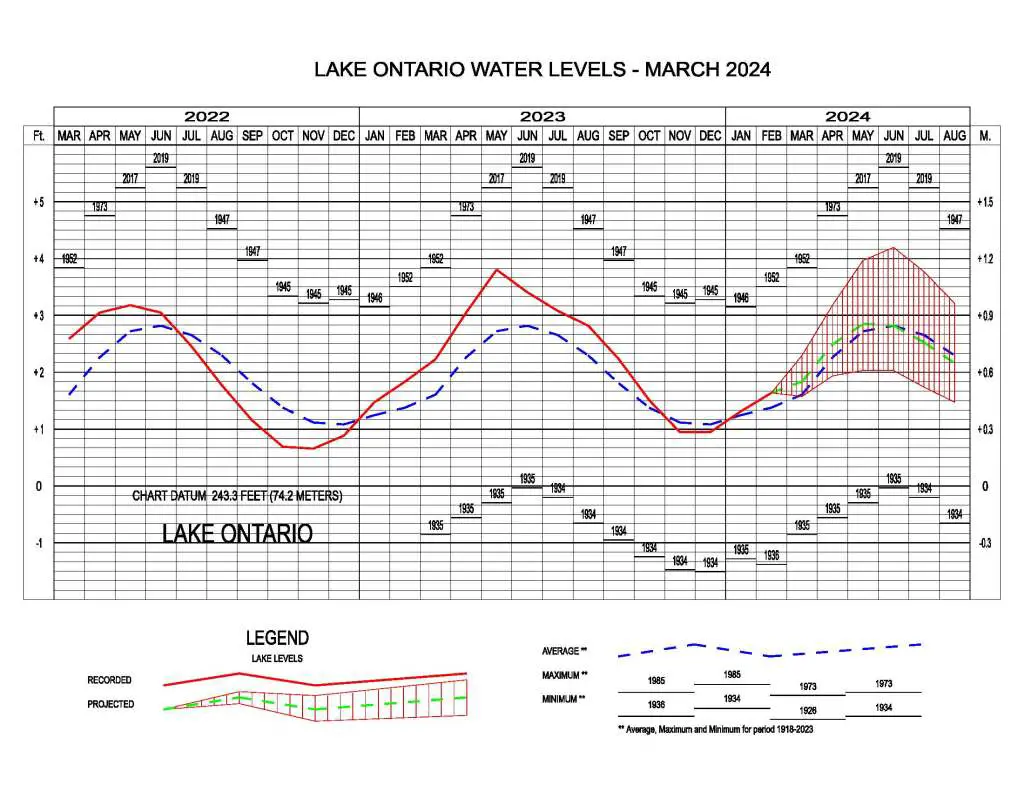
Current Month’s Water Level for Lake Ontario
Lake Ontario’s average water level rose slightly in March, going up 1 inch from February to reach 243.30 feet. This level is 5 inches less than from February of last year, 2 inches above the Long Term Average (LTA) for March, and 25 inches below the record high for March.
The monthly mean level of Lake Ontario rose by 4 inches from January to February, reaching 245.08 feet. This was 3 inches higher than its February Long-Term Average (LTA) level, but 2 inches below the level of the previous February, and 22 inches below the record-high for February set in 1952. In February, the lake had near-average water supplies. The most recent 6-month forecast predicts that Lake Ontario’s water levels will continue to rise seasonally until May. From March to August, the water levels in the lake are expected to be between 5 and 11 inches lower than the previous year and 24 to 33 inches lower than the record highs. The water levels in the lake are projected to be 3 inches above the LTA in March, April, and May, equal to the LTA in June, and then 2 inches below the LTA in July and August.
Lake Ontario is expected to be at or near its long-term monthly mean water level in 3Q 2024.
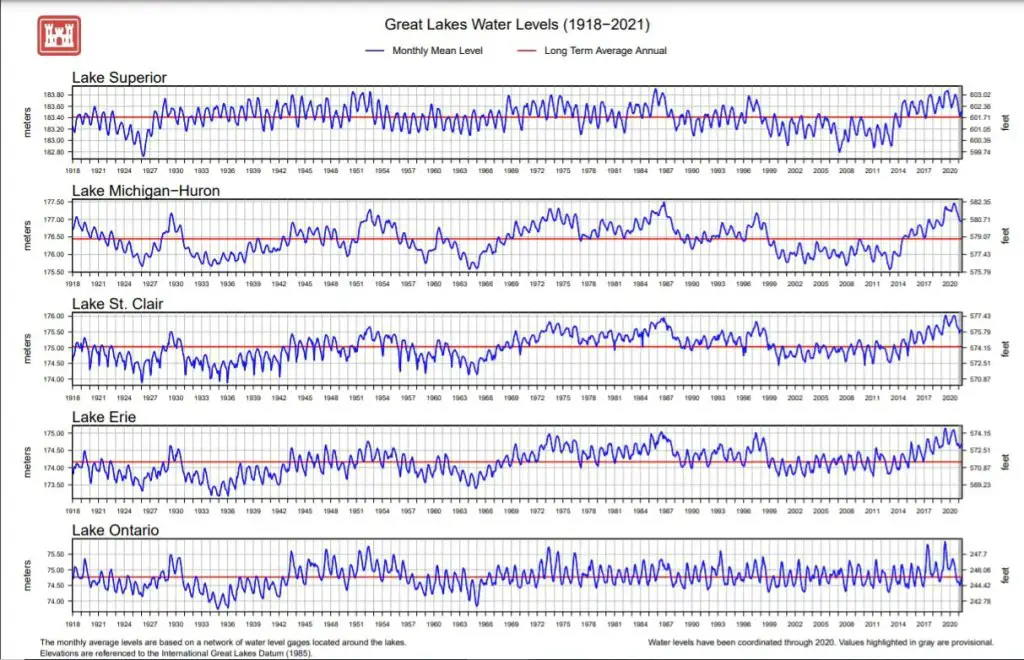
Great Lakes Water Levels History Data 1919-2021
Below are the historical monthly mean average water levels for each of the Great Lakes. All levels are referenced to the International Great Lakes Datum of 1985 (IGLD 85). Water levels have been coordinated with Canada for 1918-2020.
Dynamic Great Lakes – Lake Level Viewer – From NOAA
Key Questions on Great Lakes Water Levels
Are Great Lakes water levels climbing or receding?
All the Great Lake water levels remain above their long-term average. Except for Lake Superior, all the Great Lakes are expected to remain above their long-term averages through 3Q 2023
Why are Great Lakes water levels staying so high?
Water levels follow a seasonal cycle where water levels rise in the spring due to increased precipitation and enhanced runoff from snowmelt. In the fall, the lakes generally decline due to an increase in evaporation as temperatures decline and cold air moves over the relatively warm lake waters. However, the high rates of precipitation in the Upper Great Lakes have kept overall lake levels high.
What is the elevation of Lake Ontario above sea level?

Lake Ontario is 245 feet above sea level. Lake Ontario is the last Great Lake before entering the St. Lawrence seaway and the Atlantic Ocean.
What is the elevation of Lake Erie above sea level?

Lake Erie is 569 feet above sea level. Lake Erie is the fourth largest Great Lake and hosts the largest fishery of all the other Great Lakes combined.
What is the elevation of Lake Michigan-Huron above sea level?

Lake Michigan-Huron is 577 feet above sea level. The Straits of Mackinac connect the two lakes together.
What is the elevation of Lake Superior above sea level?

Lake Superior is 600 feet above sea level. Fun fact: Lake Superior’s deepest parts are 733 feet below sea level and maintain a temperature of 39°F.
Related Reading Great Lakes Water Levels Forecasts 2024
20 Michigan Webcams Covering the Thumb & Lake Huron Shoreline You Can View Right Now
Current Great Lakes Ice Coverage Winter 2021-2022 – Dynamically update data from NOAA and the National Weather Sevice on total Great Lakes Ice Cover
2020 Could Set New Record Water Levels Across Great Lakes – 2020 lake levels made it a record year.
Lake Huron Water Levels Approached Historic Lows – In 2012, dry conditions suggested that the Great Lakes could hit record lows not seen since 1964.
Great Lakes Ice Coverage and Water Levels in 2020 – Ice coverage of the Great Lakes for the Winter of 2020-2021
Low Water Levels in Great Lakes Threatened Marinas – The low lake levels in 2012 forced marinas to dredge and alter the boating season.
Michigan Wind Energy Map Updated – Current and forecasted wind farm projects in Michigan

This is a great report please keep me informed
Thanks Richard…a new summary is ready for Great Lakes water levels in November
This info is great! Please continue sharing it.