by
by 
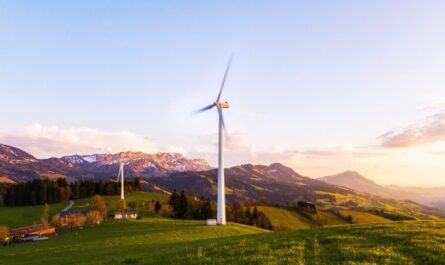
Over the past twenty years, the Great Lakes region has been steadily increasing the number of new wind projects and wind energy output. Now that pace looks to have slowed with more local communities placing acting tighter zoning control over industrial wind development. However, growth continues as the cost of new projects declines.
Michigan was an early developer of wind projects, but it achieved only a rank of fifth place among the Great Lake states in 2015.
Ranking of Great Lake States in Terms of Installed Capacity
Rank | Installed Ranking 2000 | Installed Ranking 2005 | Installed Ranking 2010 | Installed Ranking 2015 | Installed Ranking 2018 |
1st | Minnesota | Minnesota | Minnesota | Minnesota | Illinois |
2nd | Wisconsin | New York | Illinois | Illinois | Minnesota |
3rd | New York | Pennsylvania | Indiana | Indiana | Indiana |
4th | Pennsylvania | Illinois | New York | New York | New York |
5th | Michigan | Wisconsin | Pennsylvania | Michigan | Michigan |
6th | Ohio | Wisconsin | Pennsylvania | Pennsylvania | |
7th | Michigan | Michigan | Wisconsin | Wisconsin | |
| 8th | Ohio | Ohio | Ohio |
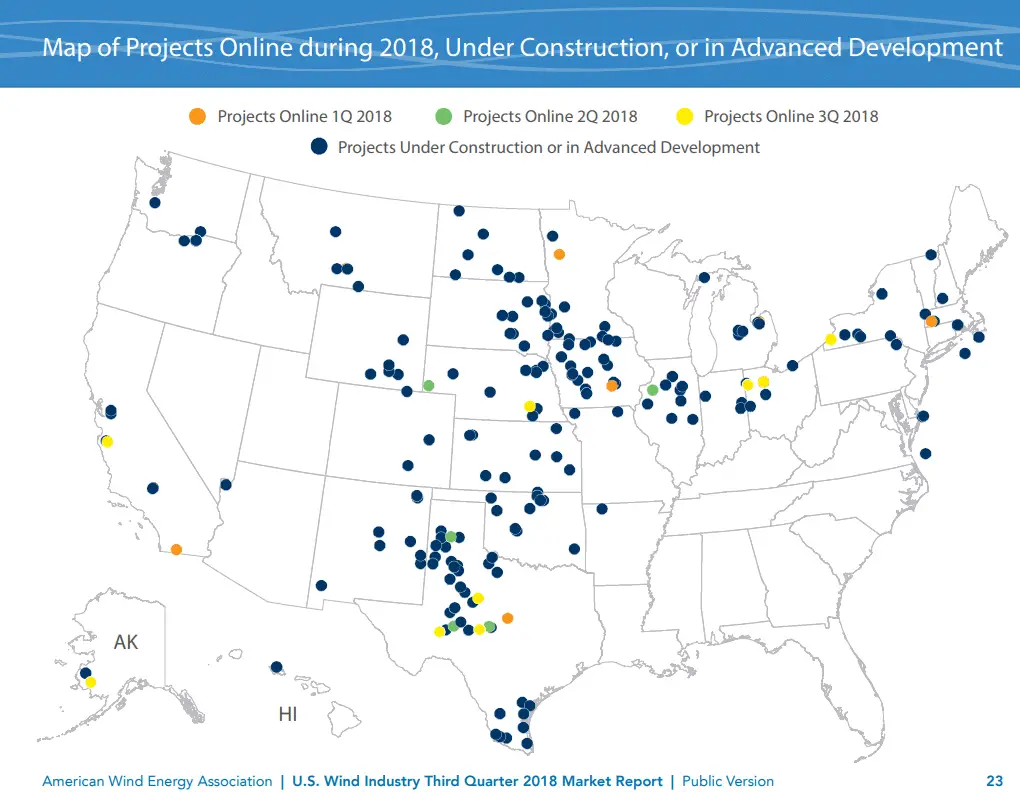
United States Installed Wind Energy Capacity 3rd Quarter 2018
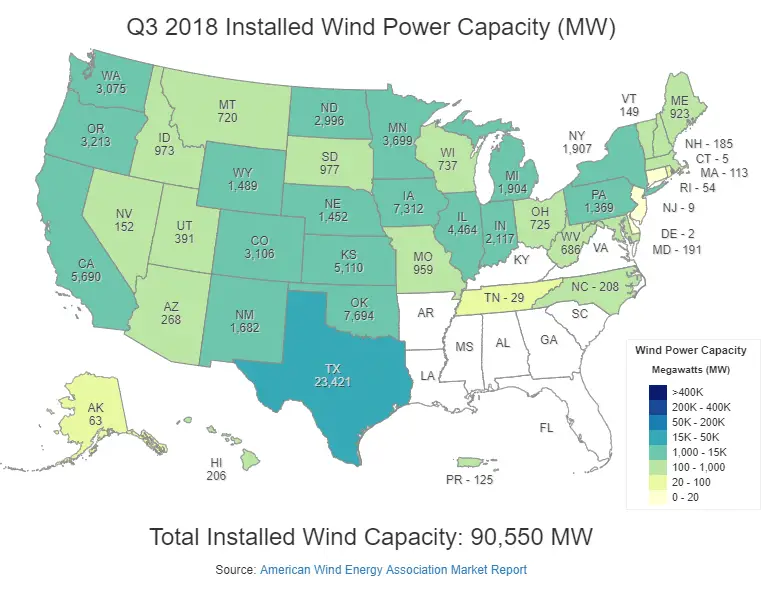
Ohio, which has lagged the region with wind projects is now among the top states in the country for new development with 108 MW being developed in 2018.
New Industrial Wind Projects in the Great Lake States 2018
State | Potential Output |
Illinois | 132 MW |
Ohio | 108 MW |
| New York | 78 MW |
| Michigan | 44 MW |
| Minnesota | 1 MW |
Wind Energy Projects Completed in 2018
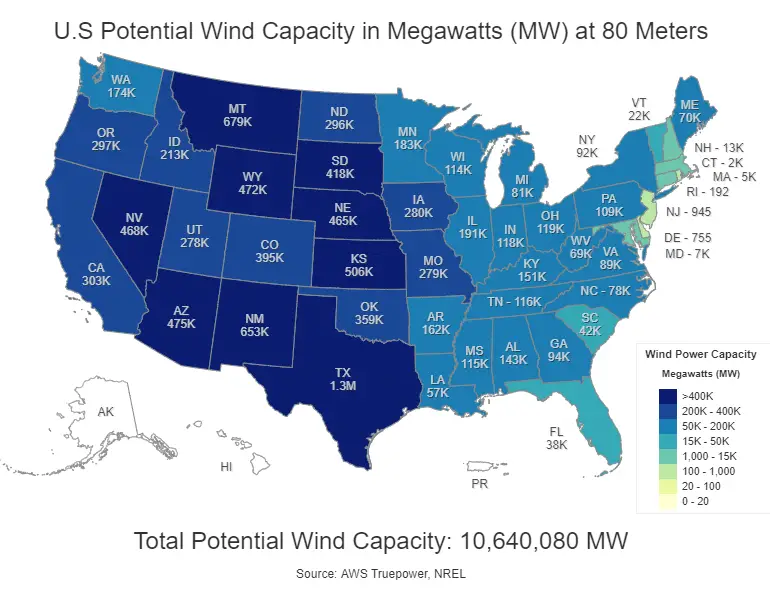
However, in terms of the growth potential, Michigan falls to dead last in wind energy potential. Wind power capacity potential reflects the amount of wind power that is technologically possible to have installed in a given region. We would not expect this potential to be fully utilized, but it is indicative of the physical limits of the assumed technology. Wind power capacity potential is estimated assuming that all available land areas after legal and technical exclusions are applied with wind turbines at a density of 3 megawatts per square kilometer.
Industrial (80m) Wind Energy Potential for the Great Lake States
State | Potential Output | Rank |
Illinois | 191,000 MW | 1st |
Minnesota | 183,000 MW | 2nd |
Ohio | 119,000 MW | 3rd |
| Indiana | 118,000 MW | 4th |
| Wisconsin | 114,000 MW | 5th |
| Pennsylvania | 109,000 MW | 6th |
New York | 92,000 MW | 7th |
| Michigan | 81,000 MW | 8th |
United States Industrial Wind Energy Potential Capacity
Sources
- U.S. Wind Industry Third Quarter 2018 Market Report: Public Version
- U.S. Installed and Potential Wind Power Capacity and Generation- Energy.gov
Related
- Will Business Force Michigan to Increase its Renewable Energy Targets?
- Failure to Extend Tax Credit May Stall Wind Projects in the Thumb
- Apple Blossom Wind Farm
- Lake Winds Energy Park