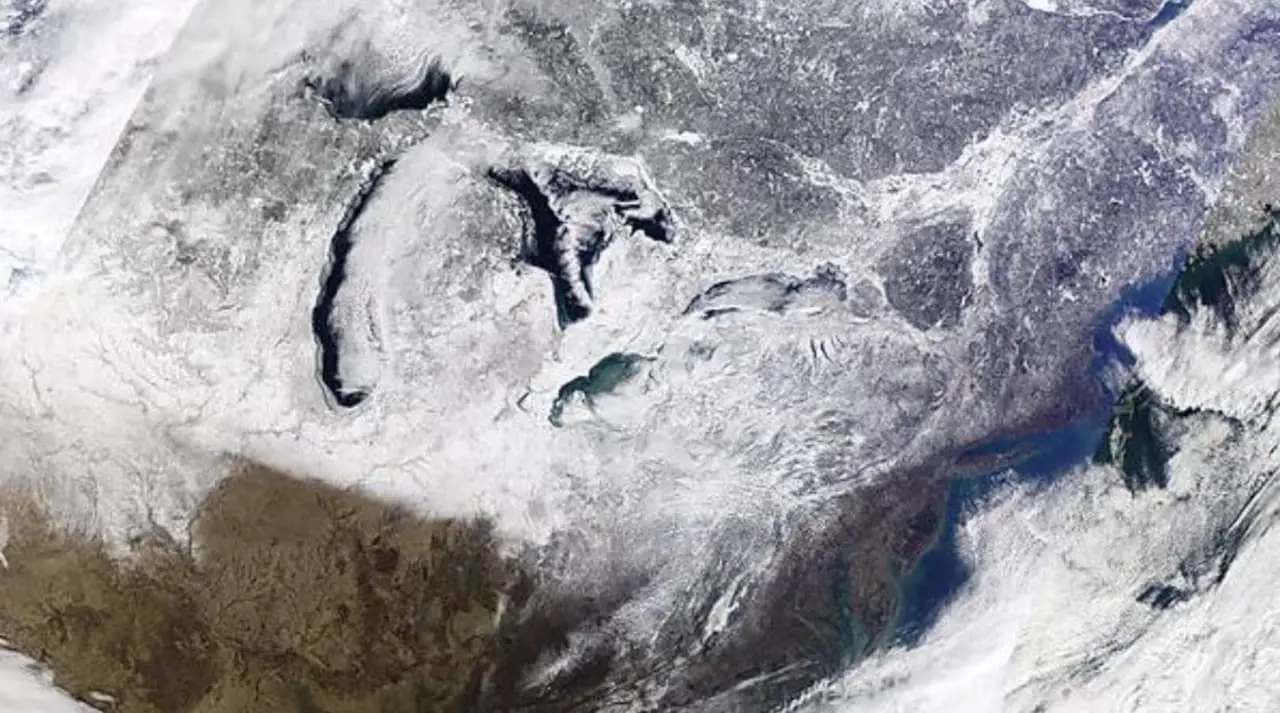
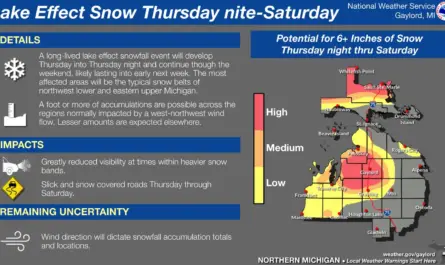
Updated February 21, 2022 – Recent extreme weather patterns and sub-zero conditions across the Upper Great Lakes region have blown away forecasts of yet another year of below-average ice cover. The recent polar vortex spikes Great Lakes ice cover. Currently, four out of the five Great Lakes are at or slightly above average reported ice concentration data (1973-2021) Except for Lake Superior which is near its average ice coverage norm for this date in the year.
What is A Polar Vortex?
According to the National Weather Service, the polar vortex is a massive region of low pressure and frigid air that surrounds both of the Earth’s poles. It is constantly present near the poles, though it weakens in the summer and intensifies in the winter. The name “vortex” refers to the counter-clockwise movement of air that aids in the retention of colder air near the Poles.
During the winter in the northern hemisphere, the polar vortex expands, bringing frigid air south with the jet stream. A Vortex event happens very frequently during the winter and is commonly connected with lengthy spells of Arctic air in the United States. For example, a Polar Vortex in January 2014 resulted in an extremely high level of ice cover in the Great Lakes. That vortex event is comparable to many previous cold outbreaks in 1977, 1982, 1985, and 1989.
Forecasts Didn’t Anticipate Weather Extremes of Winter 2021-2022
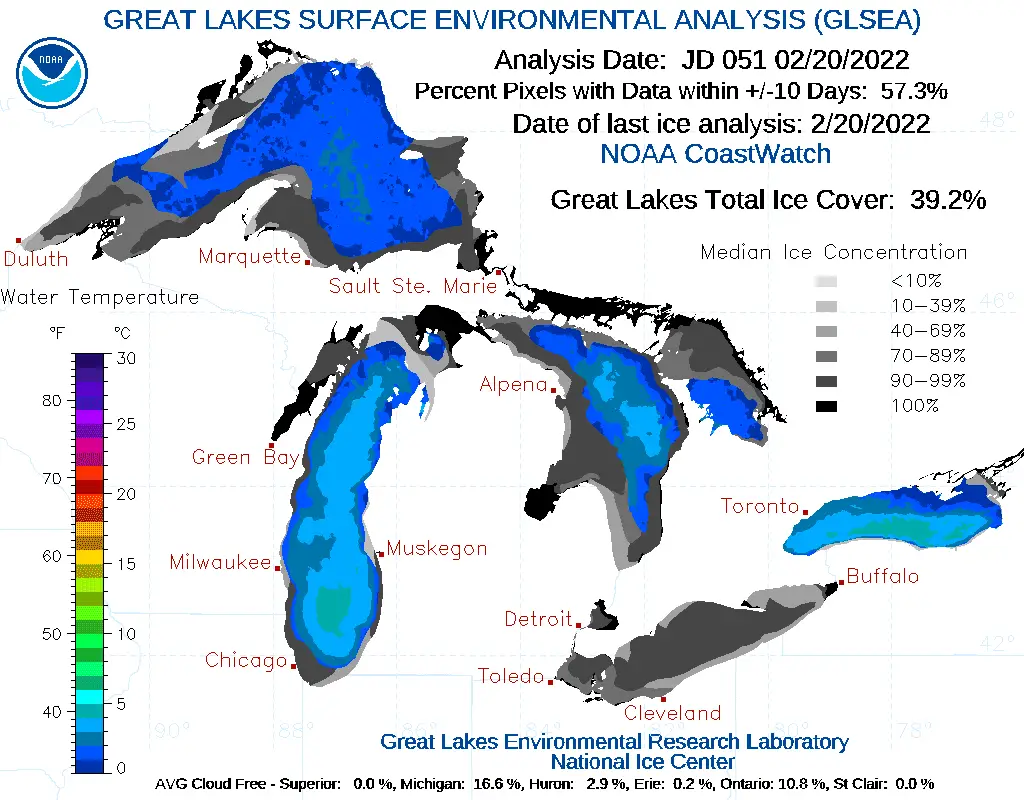
In a trend similar to the Winter of 2013, we are recording wind chills around 60 below zero in the Upper Midwest, as well as an ice storm all the way to the Gulf Coast; it is uncommon for winter weather to be this harsh. A polar vortex is combined with a very busy jet stream to cause the problem.
The arctic vortex expanding south into the Upper Great Lakes is causing temperatures to plummet to levels not seen in more than 30 years and, in some cases, breaking records. The polar vortex, which normally lies over the Arctic, is being pushed south by an exceptionally warm air mass to the north.
Great Lakes Ice Coverage Forecasts Impacted By Polar Vortex
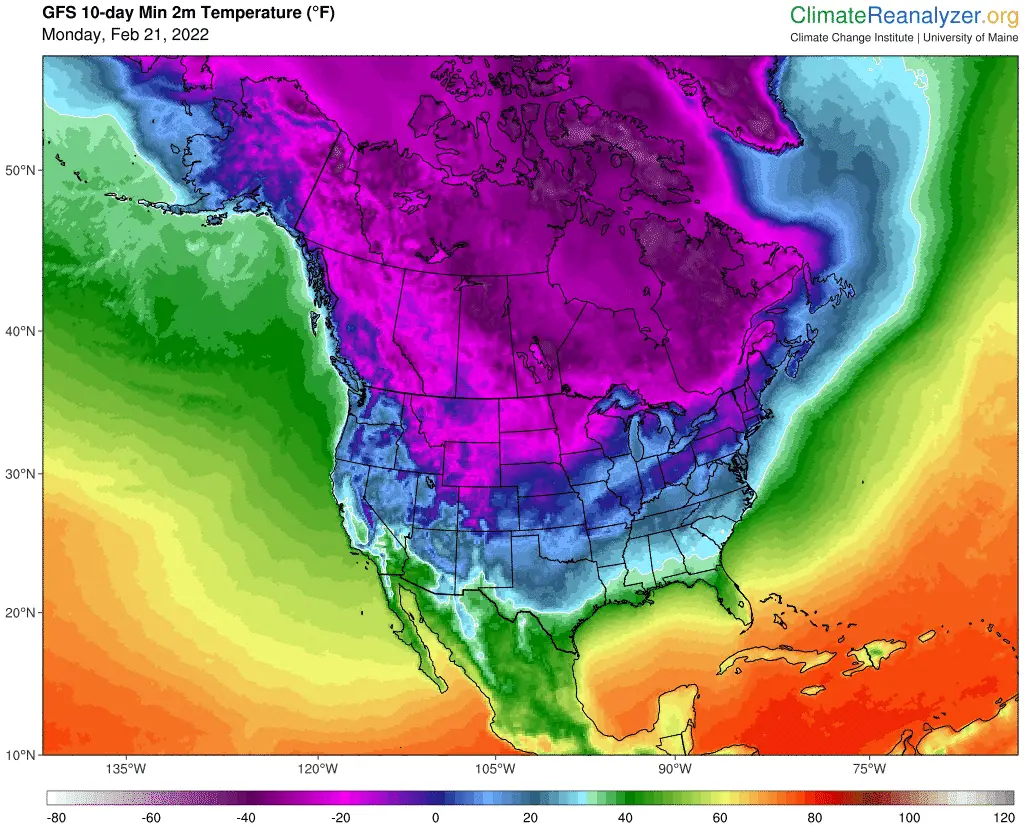
The Great Lakes Environmental Research Laboratory of the National Oceanic and Atmospheric Administration noted that at that yearly maximum figure, ice cover might be as high as 75% or as low as 25%. Since 1973, NOAA records reveal a long-term average of 50% frozen lake surface area during the yearly maximum ice cover. The overall ice cover in the Great Lakes is presently 39%, according to NOAA.
It was forecasted that Lake Michigan and Lake Huron would likely see less ice than ever at peak freeze in 2022. Lakes Michigan and Huron were both projected to be lower than they’ve been as far as the maximum ice cover for the year, about 10 and 12%, respectively. The record low ice cover record for Lake Michigan was 13% and Lake Huron was at 23%.
As of February 20th, NOAA_GLERL chart data is showing the reported ice coverage average for this date in the winter for each of the Great Lakes.
- Ice coverage of Lake Michigan at 23.75%, below the historical average of 25%.
- Ice cover on Lake Erie stands at ~80.6% way above the historical average of 65%
- Lake Huron at ~51.7%, slightly above the historical average of 50%
- Lake Superior’s ice cover stands at 35.8% slightly below its average for this day in the year.
- Lake Ontario ice coverage stands at 6.9% way below its norm of 20% this time of year.
The average annual maximum ice cover for the Great Lakes (since 1973) is 54.5%.
Winter of 2021 Set Near Record Low Ice Cover
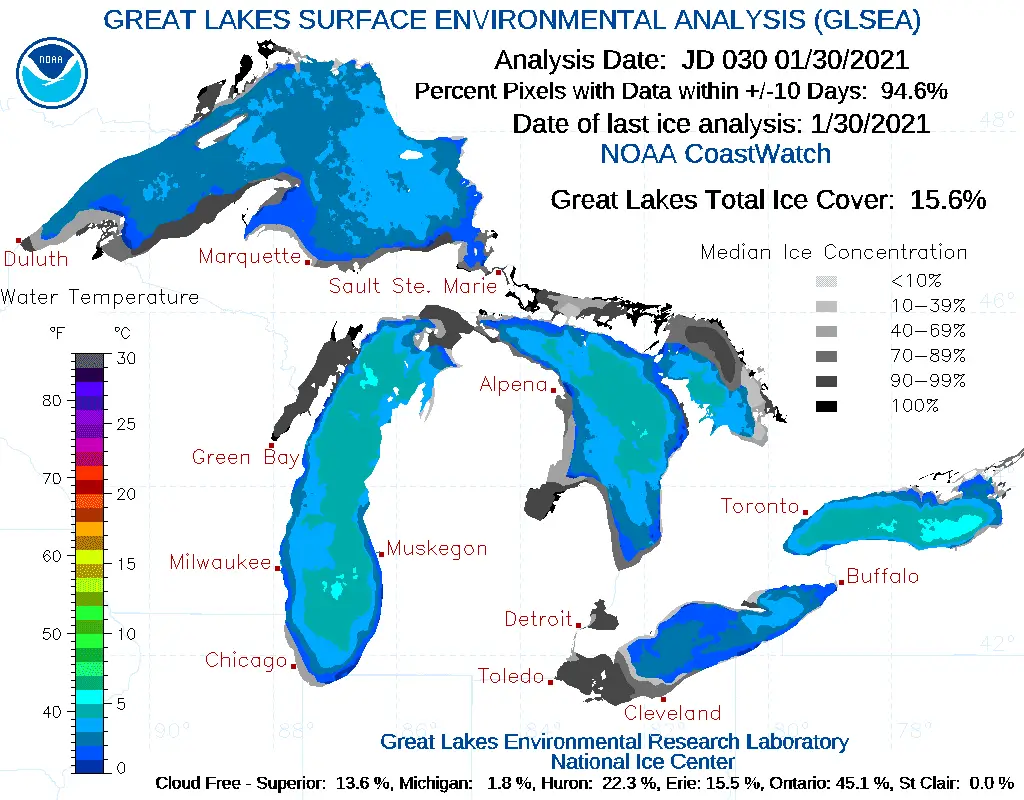
The winter of 2022 is shaping up to be a cold one with more ice cover expected as the end of February is considered the peak of the season. Last year from early January until February 1st, the ice cover had increased a miserly three-tenths of a percent to 2.4%. However, a cold snap in early February 2021 caused the ice cover to trend toward the normal range.
NOAA reported total coverage of the Great Lakes was at about 42% as of February 16th. This level was higher than NOAA’s initial projection for February 2021 of 30% By March 6, 2021, NOAA reports that coverage has dropped to 16.1%
Data On Ice Coverage For Over 50 Years
GLERL researchers are finding large changes in snow cover as a result of climate change using nearly five decades of snow data. Learning, monitoring, and predicting ice covering around the Great Lakes is critical in determining climatic designs, lake water quantities, water flow, and currents, water temperature framework, and spring plankton blooms.
Over the last three decades, NOAA GLERL has investigated the links between ice cover, river thermal structure, and regional climate utilizing historical type models and discoveries of ice, including surface water temperature and other factors. Since 1973, regular ice has covered the picture products provided by solely the Canadian Ice Service (CIS). In 1989, the United States National Ice Center (NIC) developed Great Lakes ice cover maps that incorporated Canadian and United States satellite images.
The original NOAA GLERL article may be found at Five decades of Great Lakes ice cover data.
Related Reading of Polar Vortex Spikes Great Lakes Ice Coverage
Cover photo credit from MODIS at the University of Wisconsin. The photos used to piece together this view of the United States were created using data collected from an advanced sensor onboard NASA’s Earth Observing System satellites, Terra and Aqua. Terra, traveling north to south, crosses the equator in the morning. Aqua flows in the opposite direction, crossing the equator from south to north in the afternoon. The Moderate Resolution Imaging Spectroradiometer is carried by both spacecraft (MODIS).
Discover more from Thumbwind
Subscribe to get the latest posts sent to your email.

